
Figures & data
Table 1 Baseline Demographic and Clinical Characteristics of the Study Sample
Figure 1 Mean best corrected visual acuity (BCVA) [Early Treatment Diabetic Retinopathy Study (ETDRS) charts] at baseline and at the end of the study. *Statistical significance was determined using the two-way paired Student’s t-test.
![Figure 1 Mean best corrected visual acuity (BCVA) [Early Treatment Diabetic Retinopathy Study (ETDRS) charts] at baseline and at the end of the study. *Statistical significance was determined using the two-way paired Student’s t-test.](/cms/asset/d8511b1d-1a58-4841-8a65-c2e4c19b1f88/doph_a_12177557_f0001_b.jpg)
Figure 2 Mean central macular thickness (CMT) at baseline and at the end of the study. *Statistical significance was determined using the two-way paired Student’s t-test.
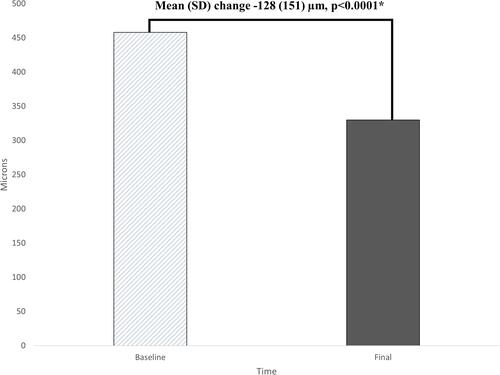
Table 2 Main Clinical Outcomes
Figure 3 A comparison of baseline best corrected visual acuity among the different groups. P values were calculated by using the two-way independent sample Student t-test.
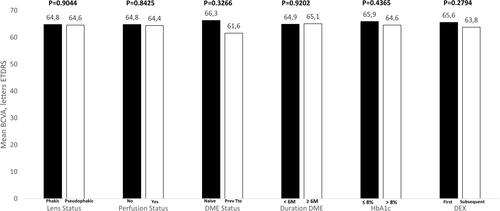
Table 3 Impact of Different Study Variables on Achieving an Improvement in BCVA ≥ 15 Letters
Table 4 Impact of Different Study Variables on Achieving an Improvement in BCVA ≥ 10 Letters
Table 5 Overview of the Incidence of Adverse Events Over the Course of the Study Follow-Up