Figures & data
Table 1 Demographics and Clinical Characteristics of Study Participants
Table 2 Comparison of the Concentric Stimulus Fields Protocols Between the Three Groups
Table 3 Comparison of the Contrast Sensitivity Protocols Between the Three Groups
Figure 1 Diopsys PERG trace of a patient from group GHM. The right eye of this participant was included in the study and had spherical equivalent of −9.75D, visual field mean deviation −11.34dB and average retinal nerve fibre layer thickness of 61µm. Left: Concentric stimulus (ConStim) protocol with 24° (top) and 16° (bottom) settings. Signal quality was good (120dBµV). (A) demonstrates the waveform obtained. The vertical axis indicates the amplitude (µV) and the horizontal axis, the time between 0 and 200 milliseconds. (B) is the strip chart, reflecting the PERG recording with artifacts represented by pronounced vertical peaks. In this case, there were 0 artifacts recorded. (C) is the frequency distribution chart, indicating the PERG response at various frequencies. The Magnitude value is obtained at 15Hz. Right: Contrast Sensitivity (ConSen) protocol with high contrast (Hc) (top) and low contrast (Lc) (bottom) settings. Signal quality was similarly good (125dBµV).
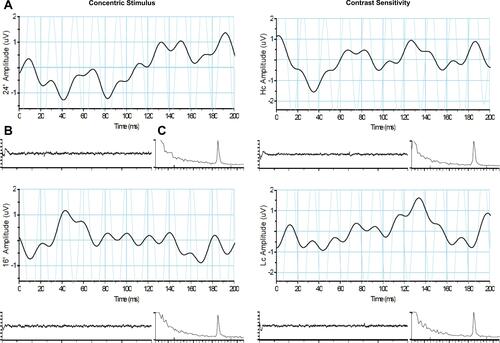
Figure 2 Diopsys PERG trace of a patient from group G. The right eye of this participant was included in the study and had spherical equivalent of +0.50D, visual field mean deviation −12.51dB and average retinal nerve fibre layer thickness of 60µm. Left: Concentric stimulus (ConStim) protocol with 24° (top) and 16° (bottom) settings. Signal quality was good (87dBµV). Right: Contrast Sensitivity (ConSen) protocol with high contrast (Hc) (top) and low contrast (Lc) (bottom) settings. Signal quality was similarly good (82dBµV).
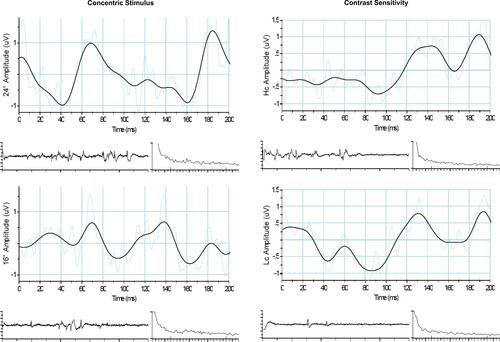
Figure 3 Diopsys PERG trace of a patient from group HM. The right eye of this participant was included in the study and had spherical equivalent of −10.87D, visual field mean deviation −17.69dB and average retinal nerve fibre layer thickness of 56µm. Left: Concentric stimulus (ConStim) protocol with 24° (top) and 16° (bottom) settings. Signal quality was good (96dBµV). Right: Contrast Sensitivity (ConSen) protocol with high contrast (Hc) (top) and low contrast (Lc) (bottom) settings. Signal quality was similarly good (86dBµV).
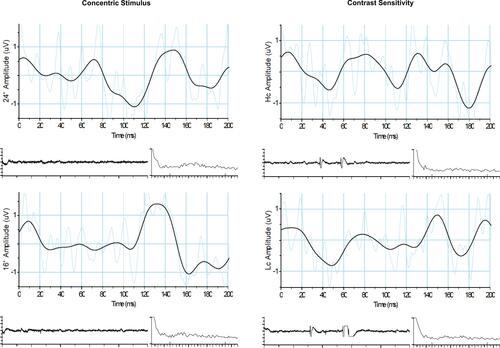
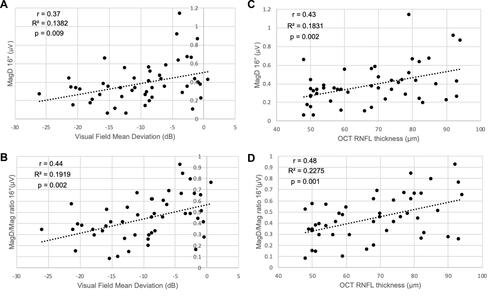
Table 4 Pearson Correlation Coefficients of MagD and MagD/Mag Ratio at 16° with the Optic Disc and Visual Field Parameter
Figure 4 Correlation plots of (A) MagD 16° and visual field mean deviation, (B) MagD/Mag ratio 16° and visual field mean deviation, (C) MagD 16° and optical coherence tomography retinal nerve fibre layer mean thickness and (D) MagD/Mag ratio 16° and optical coherence tomography retinal nerve fibre layer mean thickness.