Figures & data
Table 1 Clinical Trial and Observational Studies Describing the Patient Burden of Geographic Atrophy
Figure 1 All-cause health care resource use (first year) by patients with GA in the United States.
Notes: Study captured all-cause RU and specific contributing factors to the economic burden of GA, and differentiators between severity levels were not explored. Costs have been adjusted to 2020 US dollars. Data from Kim ACitation34.
Abbreviations: ED, emergency department; GA, geographic atrophy; RU, resource use.

Figure 2 Median monitoring costs over 2 years across GA subgroups.
Notes: Patients with GA in the study eye and GA (GA:GA), choroidal neovascularization (GA:CNV), or early/intermediate AMD (GA:E) in the fellow eye, and patients with bilateral early/intermediate AMD (E:E). Costs applied per visit were $153.63 (relating to Healthcare Resource Group service code 130: Ophthalmology; average unit cost) for a standard monitoring visit and $190.94 (relating to Healthcare Resource Group cost code BZ88A; average unit cost) for a retinal tomography visit. Estimated median costs do not include treatment costs (eg, anti-VEGF plus injection). Patients were identified in the electronic medical record system from 10 clinical sites in the United Kingdom. Analyses were restricted to patients with the year of the index date being on or after January 1, 2011, and who underwent ≥2 years of follow-up. Costs have been adjusted to 2020 US dollars. Data from Chakravarthy et alCitation3.
Abbreviations: GA, geographic atrophy; IQR, interquartile range; NR, not reported; VEGF, vascular endothelial growth factor.
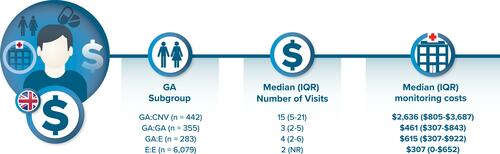
Figure 3 Medical and nonmedical resource utilization in the geographic atrophy group.
Notes: Mean (standard deviation) values are based on nonmissing values. aFor each patient, a cost was calculated for each test/procedure or treatment per period. Costs were adjusted if the patient had <24 months of history. Costs have been adjusted to 2020 US dollars. bThe unit cost per prescription was defined as the mean cost of all available prescriptions for each treatment, regardless of use. For Canada, a cost per pill was collected for amoxicillin, and because it is generally prescribed for depression with along duration of treatment, costs for its use were calculated for 6 months of treatment with aposology of one pill perday. cOnly one piece of equipment per period was considered to calculate the cost of vision-related equipment. Because the cost of reading aids was very different between the United Kingdom and Germany, the cost collected in the United Kingdom was applied to Germany. Data from Patel et alCitation22.
Abbreviation: NR, not reported.
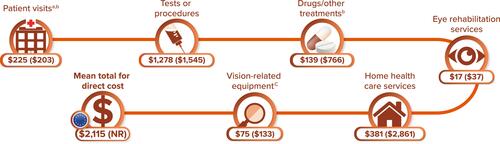
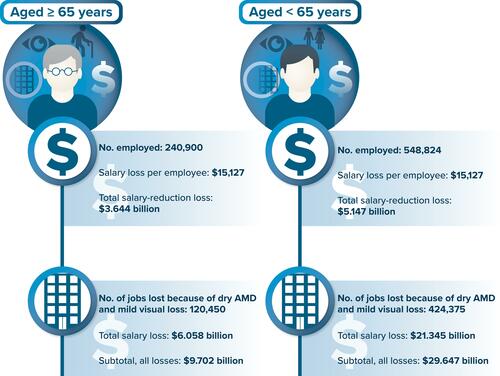
Figure 4 Annual loss to the US gross domestic product due to GA or drusen ≥125 μm in diameter.
Notes: Details on dry AMD not specified in the article. Results are pooled for GA and dry AMD with drusen ≥125 μm and thus should be interpreted with caution. Costs have been adjusted to 2020 US dollars. Data from Brown et alCitation37.
Abbreviations: AMD, age-related macular degeneration; GA, geographic atrophy; US, United States.