Figures & data
Table 1 Study Population
Table 2 Treatment Indication Distribution
Table 3 Demographics: Major Treatment Indications
Table 4 LOGMAR Visual Acuity for Total Population (Snellen VA Equivalent)
Table 5 LOGMAR Visual Acuity by Major Treatment Indication (Snellen VA Equivalent)
Table 6 OCT CST of Total Population
Table 7 OCT CST of Major Treatment Indications (Microns)
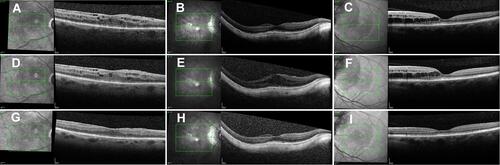
Figure 1 Macular SD-OCT of 3 patients with macular edema secondary to radiation retinopathy (A), epiretinal membrane with myopic degeneration (B), and diabetic retinopathy (C). OCT B-scans before bevacizumab injection (ABC) and 6 weeks after bevacizumab injections (D–F) show no significant improvement. However, OCT comparison scans 6 weeks after brolucizumab injections show a marked improvement in macular anatomy (G–I).