
Figures & data
Table 1 Characteristics of Patients in the Pre-COVID-19 and COVID-19 Time Periods Based on Missed Visit Statusa
Figure 1 Timeline of completed and cancelled appointments in 2021. (A) The percentage of weekly appointments cancelled by specialty. (B) The percentage of weekly appointments cancelled by visit type (return or new).
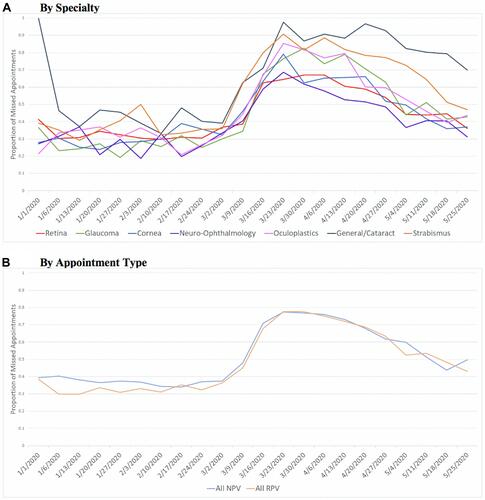
Figure 2 Reason for cancelled appointments during COVID-19 time period.
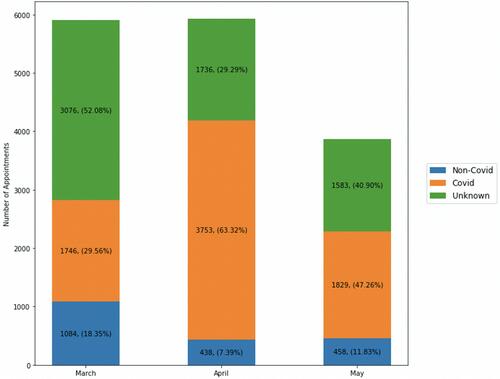
Table 2 Multivariable Logistic Regression for Odds of Missing at Least One Scheduled Clinic Visit During Pre-COVID-19 and COVID-19 Time Periods