
Figures & data
Table 1 Patient Demographics and Baseline Characteristics
Table 2 Ocular Comparison of eAMD and Dry AMD Eyes Between Initial Presentation and MDS Study Visit
Table 3 ANOVA Analysis of MDS & Pelli-Robson Outputs Comparing eAMD, Dry AMD, and Controls
Figure 1 Comparison of average contrast sensitivity thresholds (y-axis) as a function of contrast modulation ratio (x-axis) for all three groups of eyes: exudative age-related macular degeneration (eAMD), dry AMD, and controls. Threshold values are plotted in a logarithmic fashion and inversely on the y-axis. ie, performance decreases at increased contrast modulation ratios. The dots represent four contrast modulation ratios. The best-fit lines represented are exponentially fitted regressions using Excel’s GROWTH function.
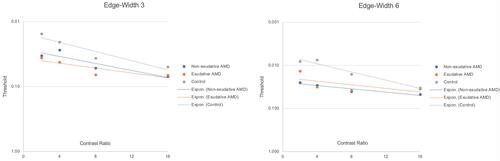
Table 4 Contrast Sensitivity Parameters for MDS and Pelli-Robson for eAMD, Dry AMD, and Control Cohorts
Table 5 Tukey HSD Post-Hoc Analysis Among eAMD, Dry AMD, and Controls