Figures & data
Figure 1 Flow of patients through the study.
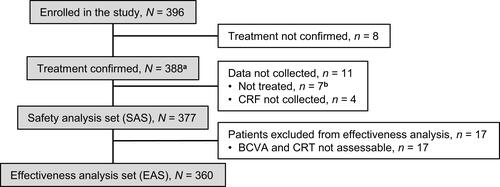
Table 1 Patient Characteristics at Baseline
Table 2 Incidence of Adverse Events
Table 3 Safety Specifications: Incidence of Serious and Non-Serious Adverse Events
Figure 2 BCVA and CRT across 24 months. (A) LogMAR BCVA and number of patients across 24 months. (B) CRT (μm) and number of patients across 24 months. Markers and whiskers show the mean and standard deviation of BCVA and CRT, respectively.
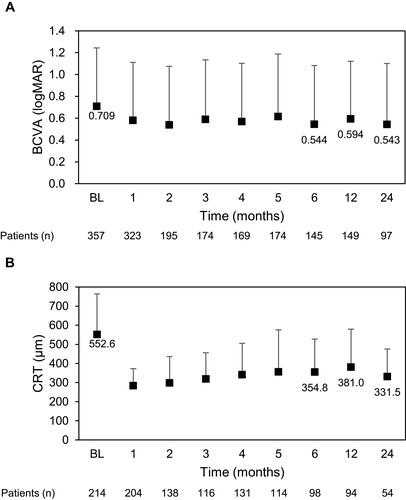
Figure 3 Subgroup analysis based on presence or absence of prior treatment. (A) LogMAR BCVA and number of patients across 24 months. (B) CRT (μm) and number of patients across 24 months. Markers and whiskers show the mean and standard deviation of BCVA and CRT, respectively.
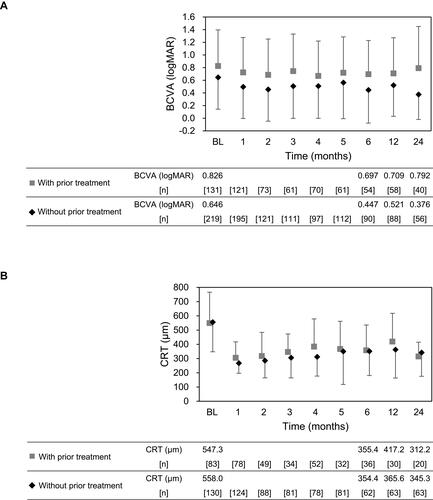
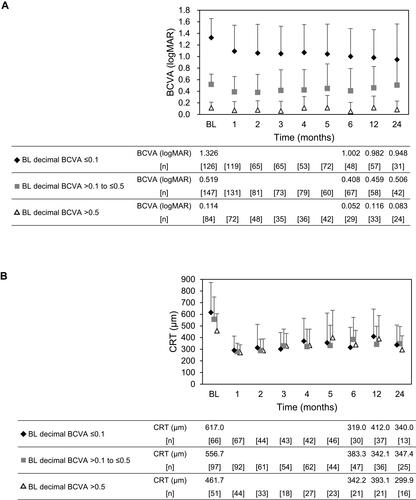
Figure 4 Subgroup analysis based on baseline decimal BCVA. (A) LogMAR BCVA and number of patients across 24 months. (B) CRT (μm) and number of patients across 24 months. Markers and whiskers show the mean and standard deviation of BCVA and CRT, respectively.