Figures & data
Table 1 Demographic Data and Median Values of BCVA, MP-1 2° and MP-1 4° Before and After Photo-Biomodulation
Figure 1 The box-plot shows BCVA at baseline and BCVA after 12 months of photo-biomodulation.
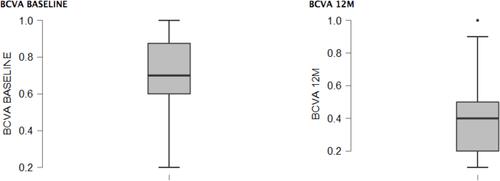
Figure 2 Median values of PERG amplitude at baseline, 1 month, 3 months, 6 months, and 12 months after photo-biomodulation.
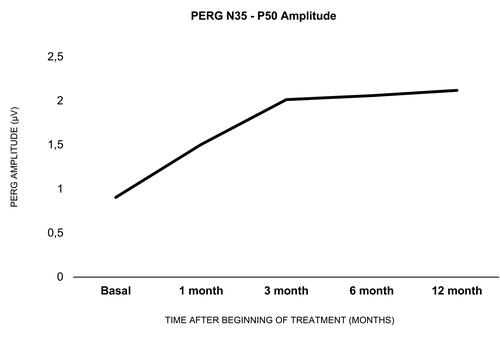
Figure 3 The graph shows improvements in fixation tested with MP-1 at the baseline and after 12 months of photo-biomodulation. Fixation 2°= median preferred retinal loci (PRL) within an area of 2° of diameter; Fixation 4°= median preferred retinal loci (PRL) within an area of 4° of diameter.
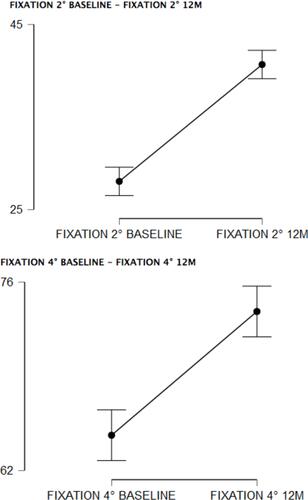
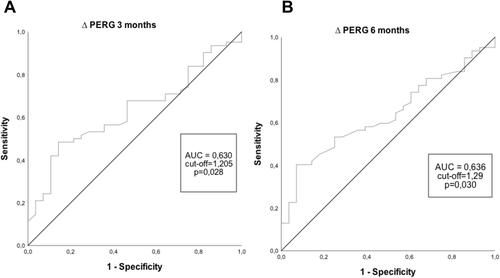
Figure 4 Receiving operating characteristic (ROC) curves were conducted to test if improvements of PERG at 1, 3, and 6 months were correlated with an improvement in BCVA. Cut-off 0.2 LogMar was determined after study enrollment in order to evaluate the correlation between PERG improvement and BCVA improvement. Cut-off values were identified with best Youden’s Index (Sensitivity + Specificity – 1) and tested with Chi-square ROC curve for improvement of PERG at 1 months. This is not shown as it was not correlated with improvement of BCVA. (A) Patients with an improvement of >1.205 at 3 months tend to present an improvement of BVCA >0.2 at 1 year. (B) Patients with an improvement of >1.29 at 6 months tend to present an improvement of BVCA >0.2 at 1 year.