
Figures & data
Table 1 Demographic and Biometric Data
Table 2 Clinical Outcomes
Figure 1 Monocular distance-corrected defocus curve three months after binocular implantation of IOL.
Abbreviations: IOL, Intraocular lens; logMAR, Logarithm of minimum angle of resolution; D, Diopters.
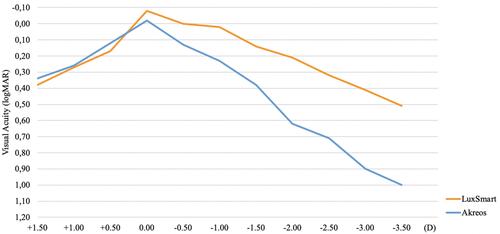
Table 3 Incidence of Photic Phenomena
Table 4 Results of Catquest 9-SF (Uncorrected Vision)