Figures & data
Table 1 Demographic Data
Table 2 Functional and Structural Outcomes
Table 3 OSI Correlations
Figure 1 The variation of some variables according to different patients groups: rigid gas permeable contact lens (RGPCL), hybrid contact lens (HCL) and silicone hydrogel/hydrogel contact lens (HGCL). (A) Mean best-corrected visual acuity with spectacles (BCVA-S) (p = 0.199) and with contact lens (BCVA-CL) (p = 0.618). (B) Mean contrast sensitivity under photopic conditions (PCS) (p = 0.006) and mesopic conditions (MCS) (p = 0.121). (C) Mean predicted visual acuities within the 100% contrast level (PVA100) (p = 0.131), within the 20% contrast level (PVA20) (p = 0.120) and within the 9% contrast level (PVA9) (p = 0.054). (D) Mean dynamically measured OSI: minimum (MinOSI) (p = 0.037), mean (p = 0.024) and maximum (MaxOSI) (p = 0.040). (E) Mean k minimum (mink) (p = 0.034), mean (p = 0.020) and maximum (maxK) (p = 0.294). (F) Mean central macular thickness (CMT) (p = 0.617), subfoveal choroidal thickness (SCT) (p = 0.822) and optic disc nerve fiber layer thickness (OD-NFL) (p = 0.818).
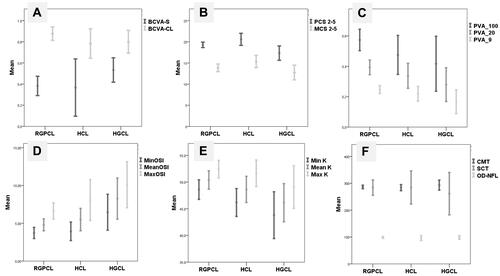
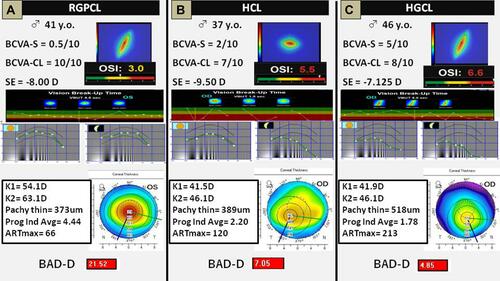
Figure 2 Three clinical examples. They were chosen because they have a similar age, gender, and spherical equivalent, fitted with 3 different contact lenses. (A) Patient fitted with a rigid gas permeable contact lens (RGPCL). (B) Patient fitted with a hybrid contact lens (HCL). (C) Patient fitted with a silicone hydrogel/hydrogel contact lens (HGCL). In all these cases, it was an increased best-corrected visual acuity with contact lens, but the other visual quality parameters differed among groups. Along with the cases (A–C), objective scatter index, vision break-up time, and contrast sensitivity worsened, despite better corneal tomographic parameters.