Figures & data
Table 1 Baseline Demographic Characteristics
Figure 1 Patient disposition. Sequence A = 0.25% reproxalap, 0.5% reproxalap, and vehicle; sequence B = 0.5% reproxalap, vehicle, and 0.25% reproxalap; sequence C = vehicle, 0.25% reproxalap, and 0.5% reproxalap.
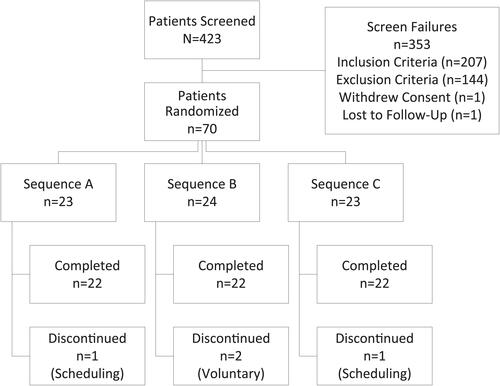
Figure 2 Patient-reported ocular itching score. P values derived from mixed effect models for repeated measures analysis of change from baseline (just prior to chamber entry) over all time points in aggregate.
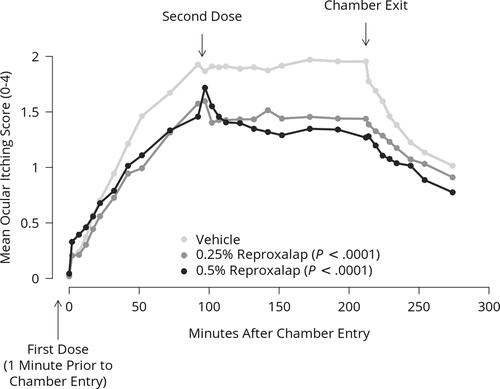
Figure 3 Patient-reported ocular tearing score. P values derived from mixed effect models for repeated measures analysis of change from baseline (just prior to chamber entry) over all time points in aggregate.
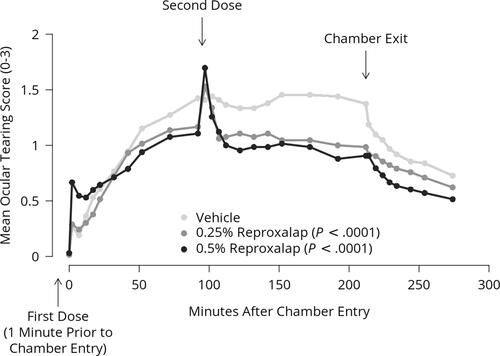
Figure 4 Investigator-assessed conjunctival redness score. P values derived from mixed effect models for repeated measures analysis of change from baseline (just prior to chamber entry) over all time points in aggregate.
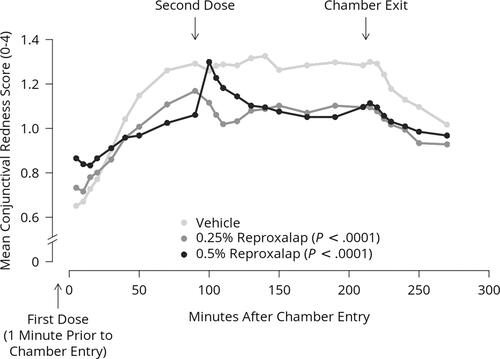
Figure 5 Time to patient-reported ocular itching score of ≥2 for 0.25% reproxalap versus vehicle. P value derived from log-rank analysis.
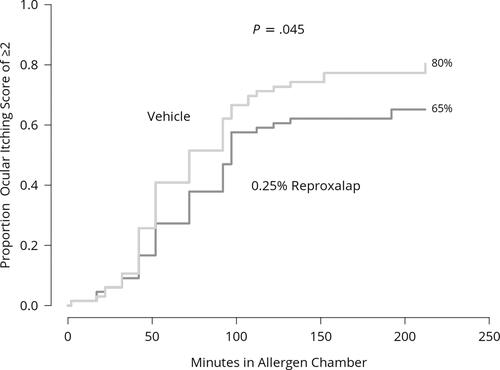
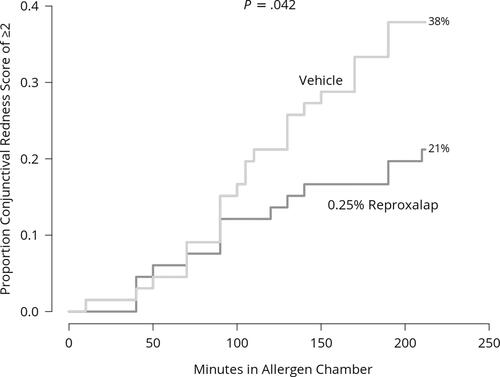
Figure 6 Time to investigator-assessed conjunctival redness score of ≥2 for 0.25% reproxalap versus vehicle. P value derived from log-rank analysis.