Figures & data
Figure 1 Visit schedule with ophthalmological examinations and intravitreal injections at all visits.
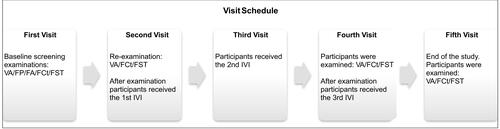
Table 1 General Demographics and Results of All Patients at Baseline
Table 2 Results of All Patients in the e-ARMD Group Before the 1st, After the 2nd and the 3rd Intravitreal Injection
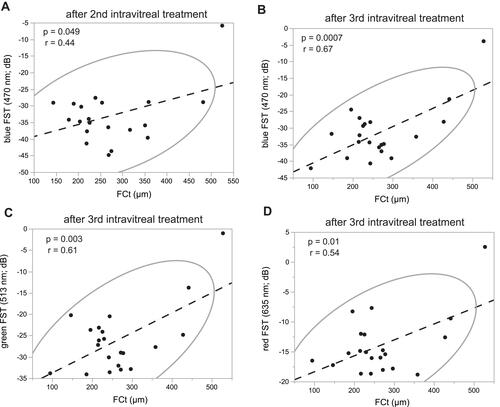
Figure 2 Correlation analysis of foveal central thickness (FCt) with parameters of the chromatic FST (blue, green and red FST). A moderate significant correlation between the blue FST and the FCt after the 2nd intravitreal treatment is shown in (A) (p = 0.04, r = 0.44 of Pearson's correlation coefficient test). After the 3rd intraviral treatment, a highly significant correlation between the blue FST and the FCt is shown in (B) (p = 0.0007, r = 0.67). For the green and red FST a similar high correlation is show after the 3rd intravitreal treatment in (C) (green: p = 0.003, r = 0.61) and (D) (red: p = 0.01, r = 0.54).