Figures & data
Table 1 Comparison of Parameters in All the Included Eyes Measured Before and 1 Month After Cataract Surgery
Figure 1 Representative measurements of upper and lower eyelid MG loss area (%). Representative measurements of upper eyelid MG by meibography on Keratograph 5M before cataract surgery (A); digitized image from A (B); meibography image after cataract surgery (C); digitized image from C (D). Representative measurements for lower eyelid MG by meibography on Keratograph 5M before cataract surgery (E); digitized images from E (F); meibography after cataract surgery (G); digitized image from G (H). Example of total analysis area (I) and detected MG area (J) used to compute the loss area (%).
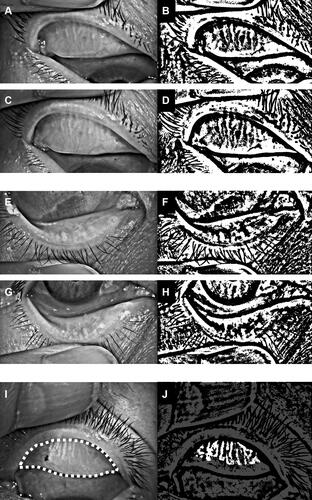
Table 2 Comparison of the Background Parameters and the Parameters Before and 1 Month After Cataract Surgery in Patients with and without Cataract Surgery-Induced Subjective DE Symptom (OSDI > 0)
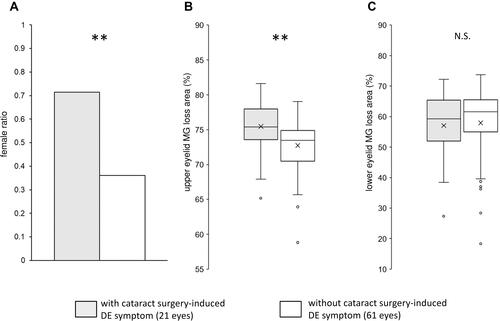
Figure 2 Baseline and preoperative ocular parameters in eyes with or without cataract surgery-induced DE symptoms. The representative baseline and preoperative ocular parameters, female ratio (A), upper eyelid MG loss area (%) (B), lower eyelid MG loss area (%) (C), are presented. The horizontal lines in the box and whisker plots represent the median values, and the bottom and top of the boxes represent the lower and upper quartiles, respectively. The x represents the mean and the bars represent the minimum and maximum values within 1.5 times the lower and upper quartiles. (**P < 0.01, generalized estimating equation models).