Figures & data
Figure 1 Pre-dilatation and post-dilatation IOP levels in group A and group B eyes.
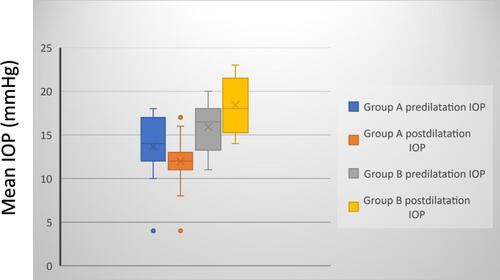
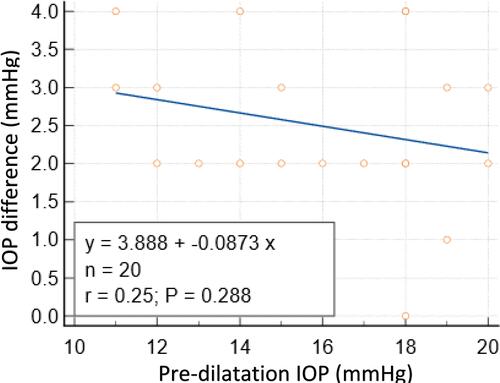
Figure 2 Linear regression analysis showing the correlation between the difference in IOP (pre-dilatation – post-dilatation) and the pre-dilatation IOP in group A.
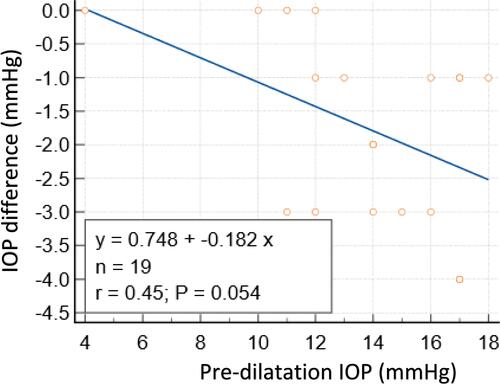
Figure 3 Linear regression analysis showing the correlation between the difference in IOP (pre-dilatation – post-dilatation) and the pre-dilatation IOP in group B.