Figures & data
Table 1 Summary of Glaucoma Prevalence Studies Around the World
Table 2 Current Available Public Datasets with Labelling and Manual Annotation for Glaucoma Fundus Images
Table 3 Comparison of Optic Cup (OC) and Optic Disc (OD) Segmentation Methods on REFUGE Test Set Using Different Metrics
Table 4 Deep Learning and Machine Learning Methods for Optic Cup and Disc Segmentation
Figure 1 Tan et al proposed CNN architecture.
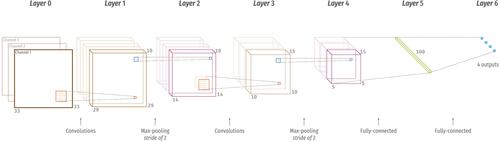
Figure 2 Spatial pyramid pooling layer: pooling features extracted using different window sizes on the feature maps.
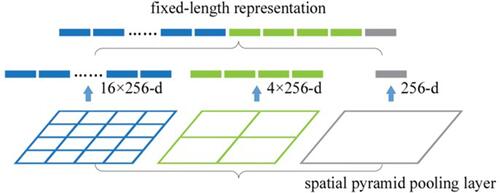
Figure 3 U-net architecture (example for 32×32 pixels in the lowest resolution). Each blue box corresponds to a multi-channel feature map. The number of channels is denoted on top of the box. The x-y-size is provided at the lower left edge of the box. White boxes represent copied feature maps. The arrows denote the different operation.
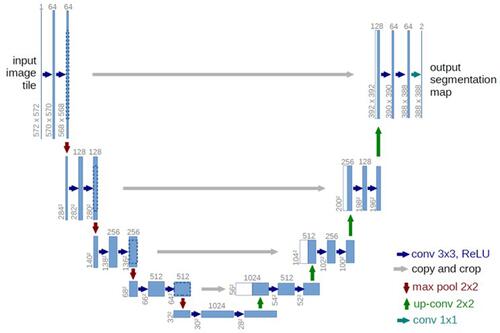
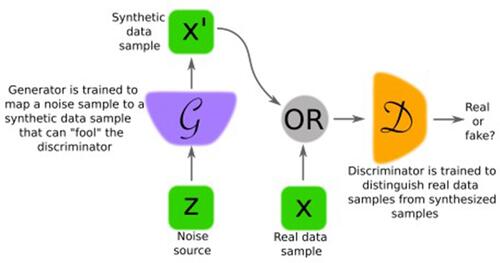
Figure 4 GAN general architecture consists of Generator (G) which output a synthetic sample given a noise variable input and a Discriminator (D) which estimate the probability of a given sample coming from real dataset. Both components are built based on neural network.