Figures & data
Figure 1 Flat vascularized failing bleb of eye 5 before needling.
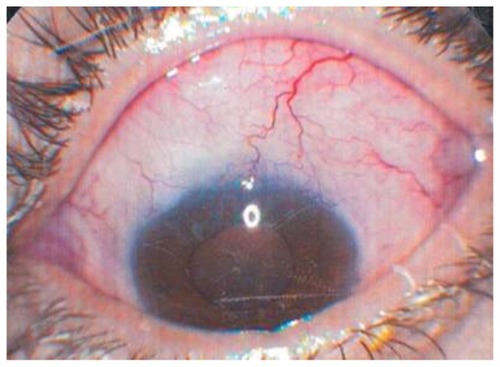
Figure 2 Less-vascularized failing, elevated bleb after first needling and 5-FU injection.
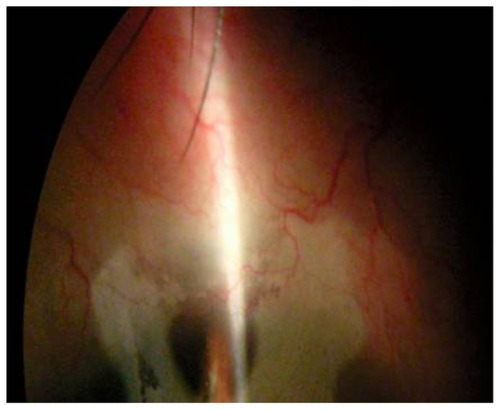
Figure 3 Preoperative serial field examination of eye 1 with advanced disease.
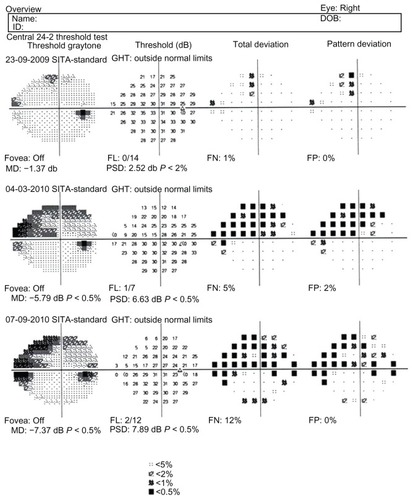
Figure 4 Preoperative serial optical coherence tomography examination of eye 1 with advanced disease.
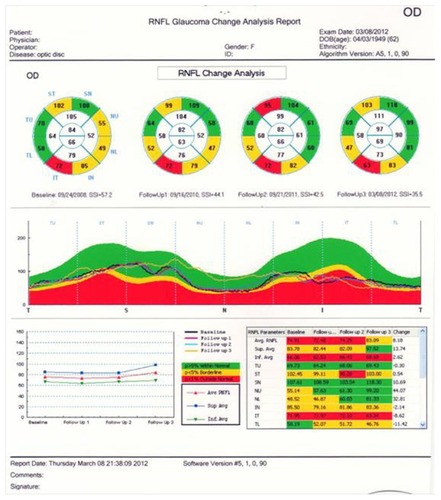
Figure 5 Two successive preoperative field examinations of eye 4 with advanced disease.
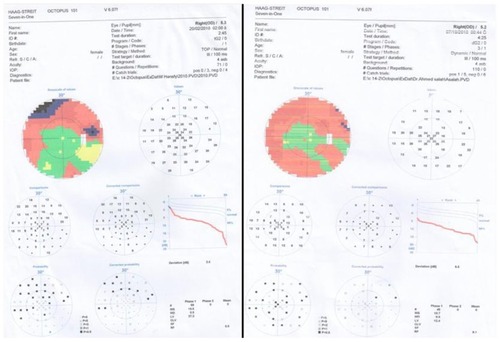
Figure 6 Two preoperative serial optical coherence tomography examinations for retinal nerve fiber layer progression of eye 4.
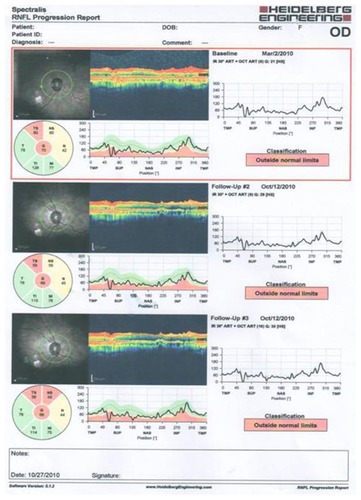
Table 1 Descriptive statistics of needling and 5-fluorouracil (5-FU) injection
Table 2 Comparison between preneedling and postneedling intraocular pressure (IOP) and medications
Table 3 Comparison between postoperative IOP of failing versus failed groups, and episcleral fibrosis versus intrascleral fibrosis groups
Table 4 Correlation between postneedling IOP and number of needlings and injections
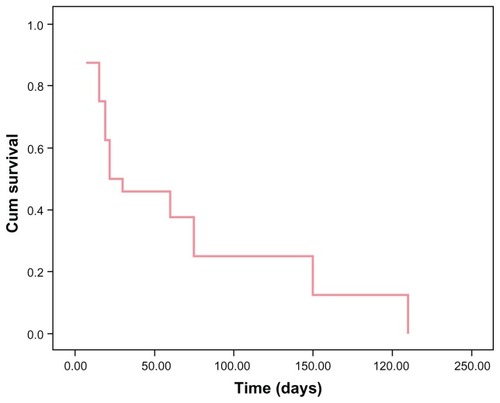
Figure 7 Kaplan–Meier curve of time to achieve target IOP.