Figures & data
Table 1 Main ophthalmologic measures of treatment are compared for the three treatment modalities
Figure 1 Hottelling’s T-squared range plot of the partial least squares regression discriminant analysis model to separate three types of astigmatism treatments.
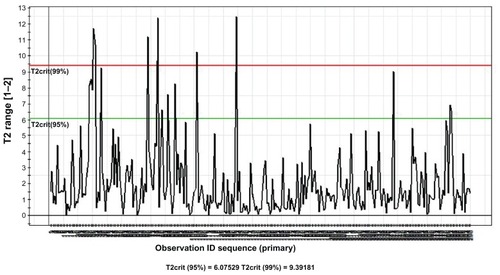
Figure 2 Scores scatter plot for partial least squares regression discriminant analysis to separate three types of astigmatism treatments.
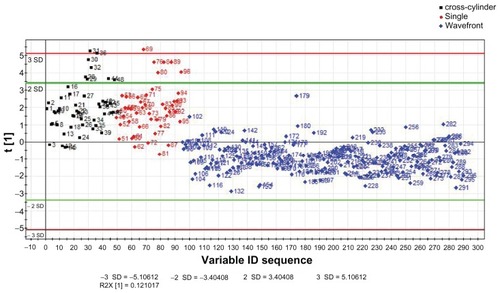
Figure 3 Loadings plot of the partial least squares regression discriminant analysis model to compare the three astigmatism treatment methods.
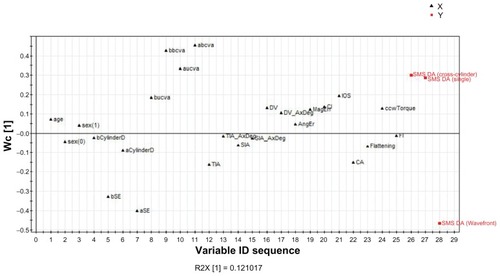
Figure 4 Plot of coefficients of variables predicting the class membership for the three astigmatism treatment methods: (A) cross-cylinder, (B) single method, (C) wavefront.
Abbreviations: bSE, spherical equivalent (before treatment); aSE, spherical equivalent (after treatment); bUCVA, uncorrected visual acuity (before treatment); aUCVA, uncorrected visual acuity (after treatment); bBCVA, best corrected visual acuity (before treatment); aBCVA, best corrected visual acuity (after treatment); TIA, target induced astigmatism; TIA_AxDeg, target induced astigmatism axis in degrees; SIA, surgically-induced astigmatism; SIA AxDeg, surgically-induced astigmatism axis in degrees; DV, difference vector; AngEr, angle of error; MagErr, magnitude of error; CI, correction index; IOS, index of success; CA, coefficient of adjustment; FI, flattening index.
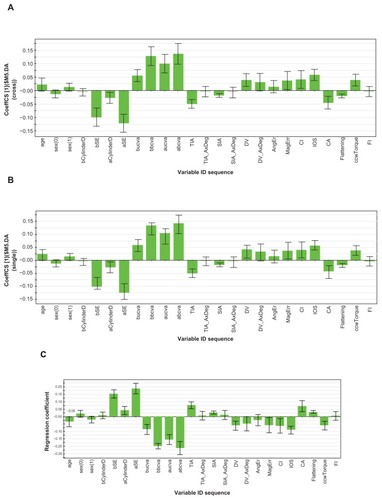
Figure 5 Validation plot to assess the validity of the fitted partial least squares regression discriminant analysis model for discriminant analysis of three astigmatism treatment modalities.
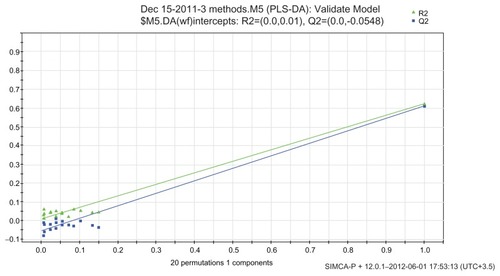
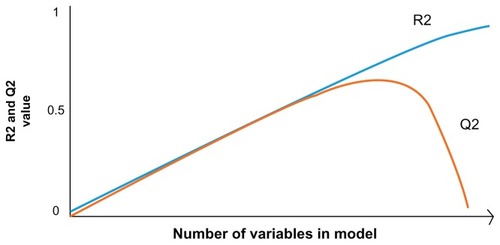
Figure 6 Pattern of change in R2 compared to Q2, with increasing model complexity (X-axis).