Figures & data
Table 1 Patient Demographic and Preoperative Data
Figure 1 Postoperative residual astigmatism. Double-angle plots of postoperative residual astigmatism at postoperative month 1 and 3 in all (top), WTR (middle) and ATR (bottom) eyes. No significant (p < 0.05) differences were observed.
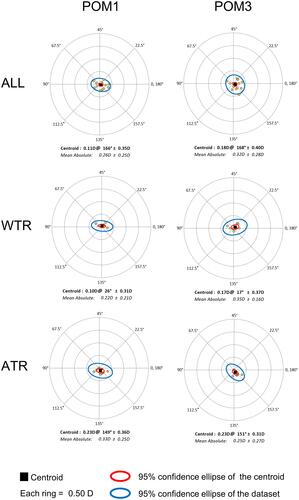
Figure 2 Estimated preoperative total corneal astigmatism. Double-angle plots of preoperative total corneal astigmatism estimated using the Barrett toric calculator incorporating measurements from each device or their median values. Barrett toric calculations made using measurements from IOLM SK with PCA produced significantly lower mean absolute total corneal astigmatism compared to IOLM TK and Pentacam groups for all eyes and ATR eyes. IOLM SK with PCA calculations demonstrated significantly lower x-component of the centroid total corneal astigmatism compared to IOLM TK, OPD scan and median measurements groups in ATR eyes. In WTR eyes, significant difference in mean absolute or centroid total corneal astigmatism was observed across devices or calculation methods. *p < 0.05 and **p < 0.01 compared to IOLM SK with PCA; †p < 0.05 and ‡p < 0.01 for x-component of centroid preoperative total corneal astigmatism compared to IOLM SK with PCA.
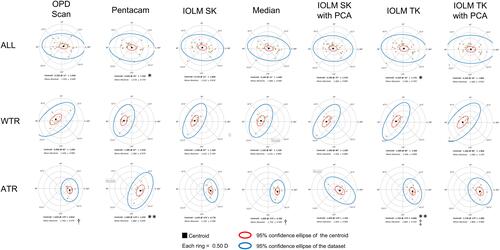
Table 2 Recommended Toric IOL Cylinder Power and Axis Calculated Using the Barrett Toric Calculator Incorporating Measurements from Each Device or Their Median Values
Figure 3 Absolute residual astigmatism prediction errors. Box and whisker plots of absolute residual astigmatism prediction errors across devices and calculation methods at postoperative month 1 (A) and postoperative month 3 (B) in all eyes. The mean absolute residual astigmatism prediction error is denoted by the +. Central horizontal lines represent the median prediction errors and whiskers extend to the 10th and 90th percentiles. There was no significant difference in mean absolute prediction error across devices and calculation methods at either time point.
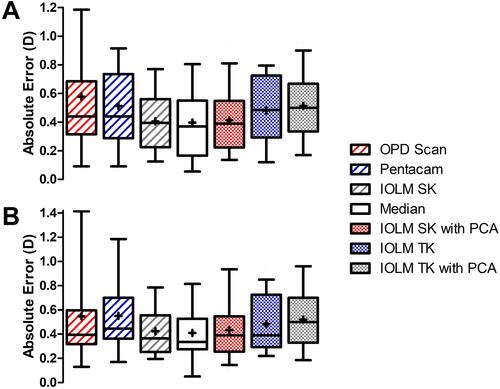
Figure 4 Mean absolute and centroid residual astigmatism prediction errors in WTR eyes. Double-angle plots of residual astigmatism prediction errors in WTR eyes at postoperative month 1 (top) and postoperative month 3 (bottom). Mean absolute and centroid residual astigmatism prediction errors were not significantly different across devices or calculation methods at postoperative month 1 or month 3 (p > 0.05).
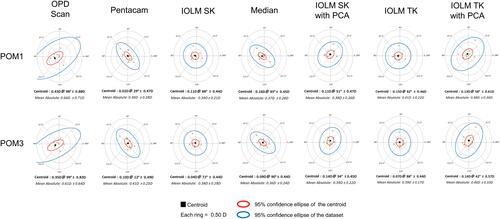
Figure 5 Mean absolute and centroid residual astigmatism prediction errors in ATR eyes. Double-angle plots of residual astigmatism prediction errors in ATR eyes at postoperative month 1 (top) and postoperative month 3 (bottom). There was no significant difference in mean absolute residual astigmatism prediction error across groups at either time point. The x-component of the centroid prediction error was significantly higher in the IOLM SK with PCA group compared to the IOLM TK, Pentacam and median measurements groups at postoperative month 1 and 3. The y-component of the centroid was not significantly different across groups at either time point. *p < 0.05, **p < 0.001 for x-component of centroid residual astigmatism prediction error compared to IOLM SK with PCA.
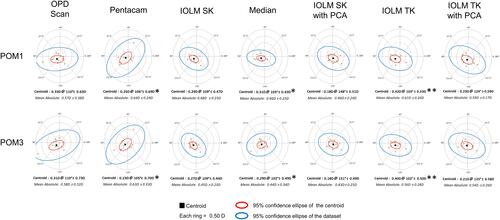
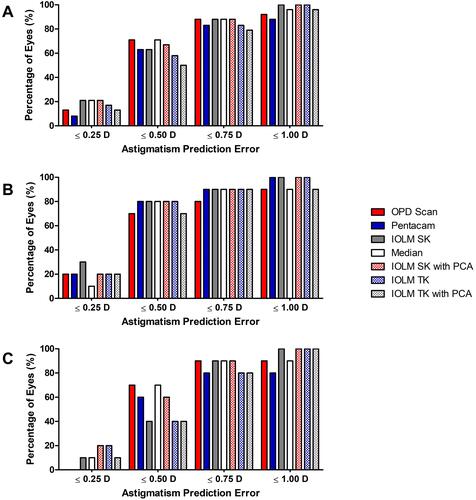
Figure 6 Percentage of eyes with absolute residual astigmatism prediction errors ≤ 0.25, 0.5, 0.75 and 1.0 D. No significant difference in the percentage of eyes with absolute prediction errors within each range was observed across devices or calculation methods for all eyes (A), WTR eyes (B) and ATR eyes (C) at postoperative month 3.