Figures & data
Figure 1 Markov model.
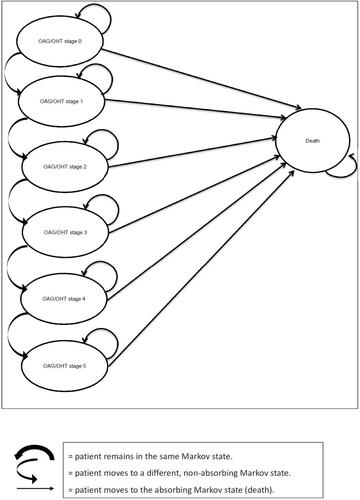
Table 1 Unit Cost for Healthcare Resources, Utility and Disutility Values (Costs in €2020)
Figure 2 (A) Markov trace for the hypothetical cohort of patients on STN1013001. (B) Markov trace for the hypothetical cohort of patients on latanoprost.
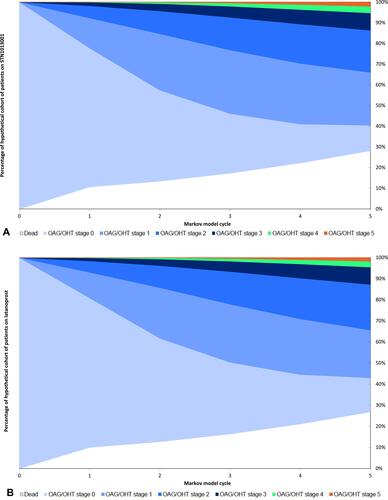
Table 2 Costs per Patient and Cost–Utility Analysis (Costs in €2020)
Figure 3 One-way sensitivity analysis: results concerning the first 10 parameters of the Markov model that causes the widest variations in base case ICUR (€2020).a,b
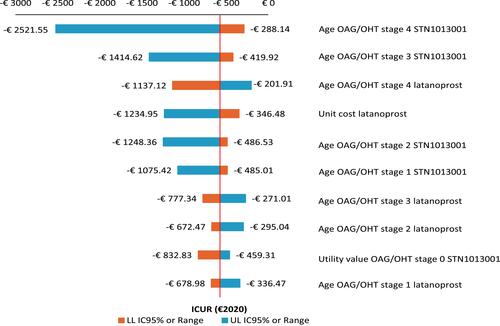
Figure 4 Probabilistic sensitivity analysis. Cost-effectiveness plane (10,000 out of 10,000 Monte Carlo iterations reported) (ΔC in €2020).a,b
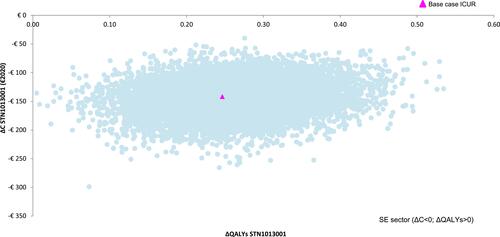
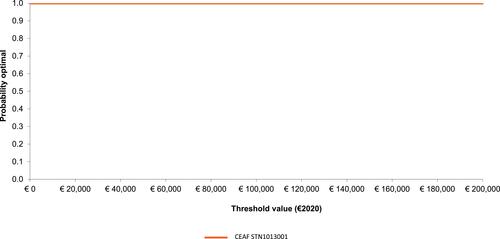
Figure 5 Probabilistic sensitivity analysis. Cost-effectiveness acceptability curve (1000 out of 1000 threshold values reported) (€2020).a
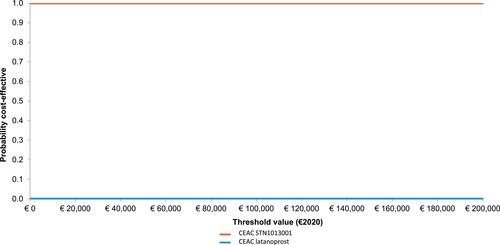
Figure 6 Probabilistic sensitivity analysis. Cost-effectiveness acceptability frontier (1000 out of 1000 threshold values reported) (€2020).a,b