Figures & data
Table 1 Demographic and Preoperative Data for Study Participants
Table 2 Postoperative Comparisons of All Measured Clinical Parameters
Table 3 Values of Constants ai and bi
Figure 1 Relative efficacy as a function of each parameter score.
Abbreviations: UDVA, uncorrected distance visual acuity; UIRA, uncorrected intermediate reading acuity (at 60 cm); UICPS, uncorrected intermediate critical print size (at 60 cm); UNRA, uncorrected near reading acuity (at 40 cm); UNCPS, uncorrected critical print size (at 40 cm); CS, contrast sensitivity; SFP (total), spectacle-free patient (all distances); SFP-DV, spectacle-free patient for distance vision activities; SFP-NV, spectacle-free patient for near vision activities; VF-14, Visual Function Index questionnaire.
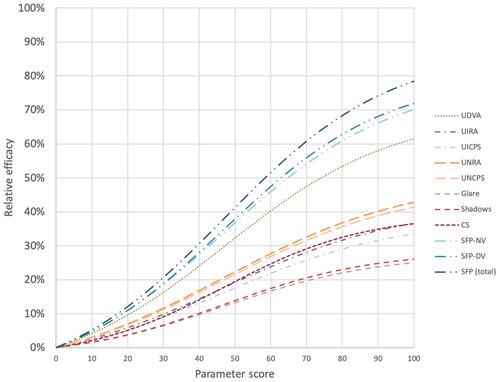
Table 4 Relative Efficacy of Each Intervention
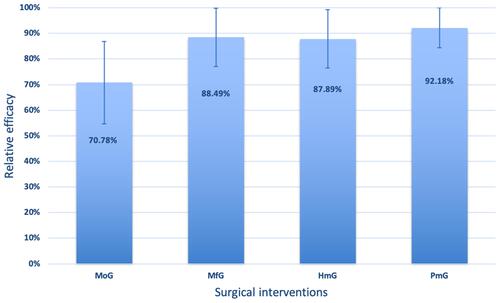
Figure 2 Relative efficacy of each intervention.
Abbreviations: HmG, Hybrid Monovision Group; MfG, Multifocal Lens Group; MoG, Monovision Group; PmG, Premium Monovision Group.