Figures & data
Table 1 Mean Acquisition Time for the Different Devices
Table 2 Agreement of K1, K2, TK1, TK2, EKR1 and EKR2 (Diopters) Measurements Between the Three Devices
Figure 1 Bland-Altman plots obtained showing the mean difference versus average for the comparison between the different devices for K1 and K2. Mean (continuous line), lower and upper limits of agreement (±1.96SD, standard deviation, peripheral dotted lines) and lower and upper confidence intervals (95%) are depicted.
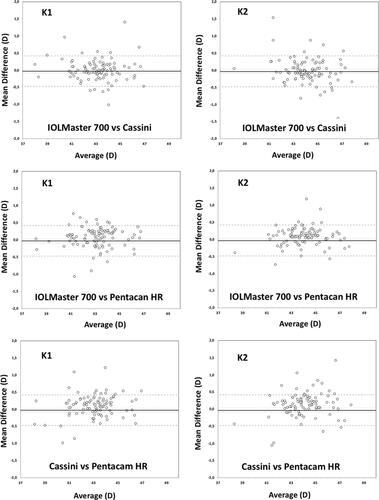
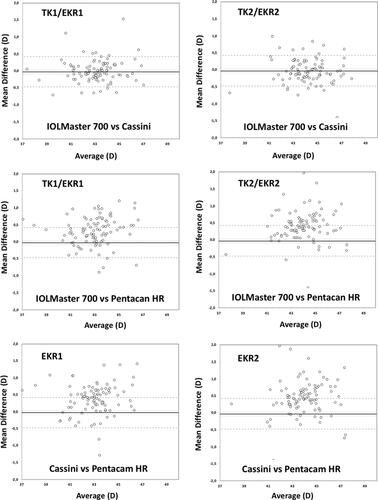
Figure 2 Bland-Altman plots obtained showing the mean difference versus average for the comparison between the different devices for TK1, TK2, EKR1 and EKR2. Mean (continuous line), lower and upper limits of agreement (±1.96SD, standard deviation, peripheral dotted lines) and lower and upper confidence intervals (95%) are depicted.