Figures & data
Figure 1 Syringe used for suprachoroidal injection.
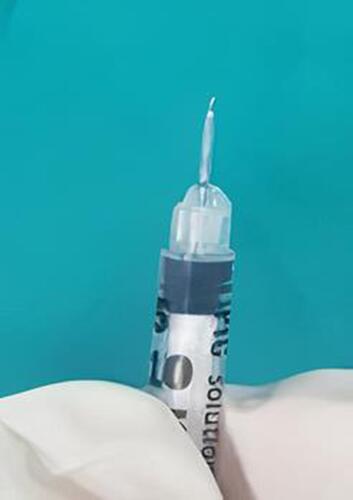
Figure 2 Injection of TA in the suprachoroidal space using a custom-made syringe.
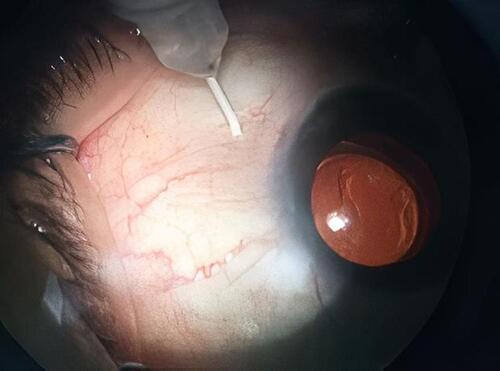
Figure 3 UBM after SC injection in case no.8 in the 4mg SC group.
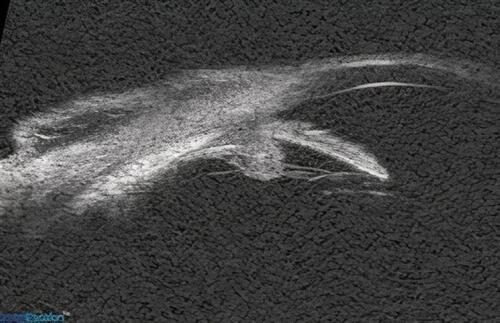
Table 1 Baseline Data
Table 2 Comparison Between the 3 Groups Regarding BCVA Through the Follow-Up Period
Table 3 Comparison Between the 3 Groups Regarding the Difference in BCVA from Presentation to 1, 3, and 6 Months
Table 4 Follow-Up of BCVA in Each of the 3 Groups Throughout the Follow-Up Period
Figure 4 Chart showing the change of BCVA throughout the follow-up period in the 3 groups (logMAR).
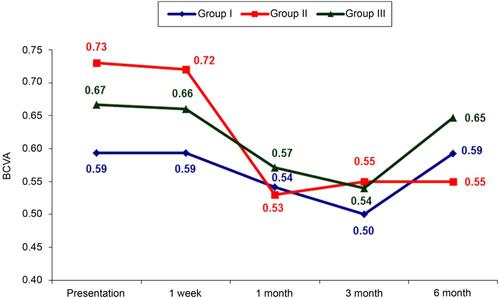
Table 5 Comparison Between the 3 Groups Regarding CMT Through the Follow-Up Period
Table 6 Follow-Up of CMT Throughout the Follow-Up Period in the 3 Groups
Table 7 Comparison Between the 3 Groups Regarding the Difference in CMT from Presentation to 1, 3, and 6 Months
Figure 5 Radial OCT images of eye no.14 in group I ((A) At presentation, (B) 1 month after injection, (C) 3 months after injection, (D) 6 months after injection).
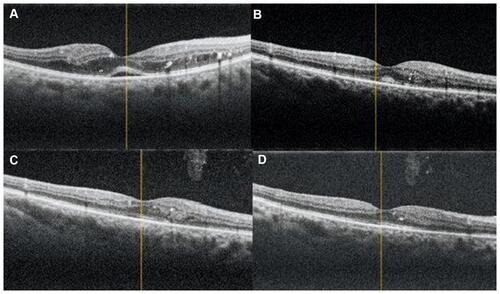
Figure 6 Radial OCT images of eye no.5 in group II ((A) At presentation, (B) 1 month after injection, (C) 3 months after injection, (D) 6 months after injection).
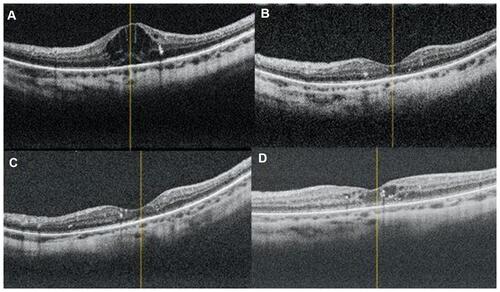
Figure 7 Radial OCT images of eye no.2 in group III ((A) At presentation, (B) 1 month after injection, (C) 3 months after injection, (D) 6 months after injection).
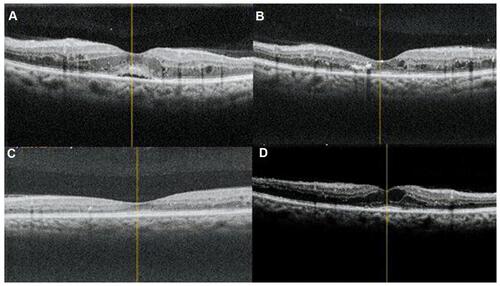
Figure 8 Chart showing the change of CMT throughout the follow-up period in the 3 groups (µm).
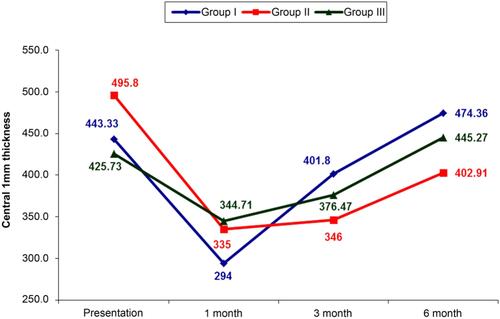
Table 8 Comparison Between the 3 Groups Regarding IOP Through the Follow-Up Period
Table 9 Follow-Up of IOP in Each of the 3 Groups Throughout the Follow-Up Period
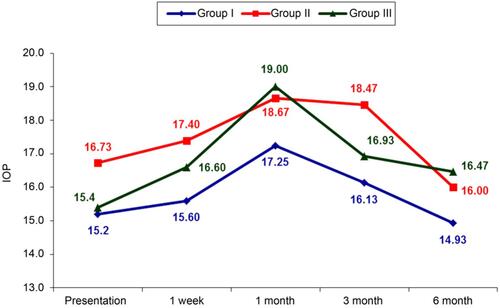
Figure 9 Chart showing the change of IOP throughout the follow-up period in the 3 groups (mmHg).