
Figures & data
Figure 1 Structural features of the lamellar macular hole types (tractional vs degenerative) studied by optical coherence tomography. Representative images of the tractional type are shown: (A) the callipers show the following measurements - Purple: base size of the hole; Red: top size of the hole. The schisis of the retinal layers is visible from the multiple narrow hyperreflective tissue bridges crossing the intraretinal splitting; (B) A tractional LMH with posterior vitreous detachment (yellow triangle), intraretinal cavities, sharp splitting edges, and EZ continuity are shown in the “moustache”-like morphology; (C) The traction of the ERM on the top of retina pulls the edges antero-lateral, thus splitting the retinal layers into a lamellar macular hole. The purple calliper measures the top size of the hole, while the red calliper measures the MFT. Representative images of the degenerative type are shown: (D) A round-edged cavitation, with a foveal bump and epiretinal proliferation is detected in the “top hat” morphology. The MFT was measured manually using a calliper (Purple), as the thinnest vertical distance from the base of the LMH down to the Bruch’s membrane. Horizontal lines - purple: Bruch’s membrane, blue: Ellipsoid Zone (EZ); green: Outer Nuclear Layer (ONL); (E) Round-edged cavitation, with a foveal bump, and EZ disruption (blue horizontal line); MFT (red); (F) the callipers show the following measurements - Purple: top size of the hole; Red: base size of the hole.
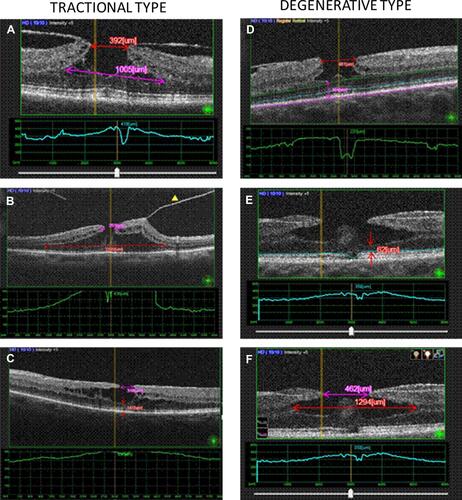
Table 1 Characteristics of the Studied Population
Table 2 Preoperative OCT Characteristics of the Studied Population
Table 3 Postoperative Anatomical OCT Parameters
Figure 2 Relationship between pre- and post- operative BCVA (logMAR) in the studied groups. (A) LMH type; (B) vitrectomy; (C) tamponade. *P<0.05; **P<0.01.
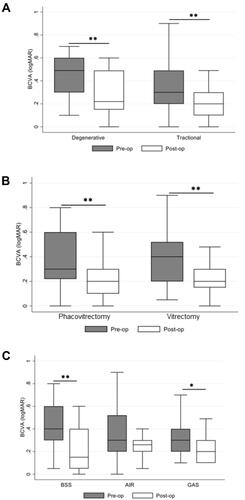
Table 4 Relationship Between Pre- and Postoperative BCVA (logMAR) in the Studied Groups