Figures & data

Figure 1 A map of the binocular visual field. Comparison of stimulus locations in the traditional Esterman test (grey circles) and the modified Esterman, mET (red triangles). The brown symbols are overlapping points.
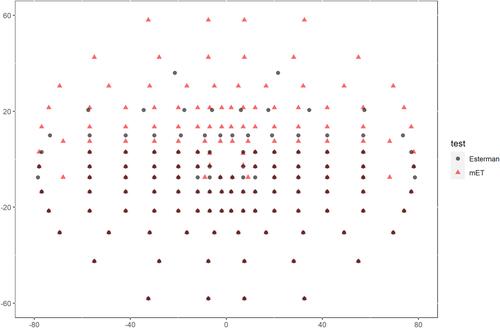
Figure 2 (A) Example live output from modified Esterman (mET) showing points seen in green and not seen in red. Number of points presented is also shown as well as false positive responses. (B) Example graphical output on completion of the mET.
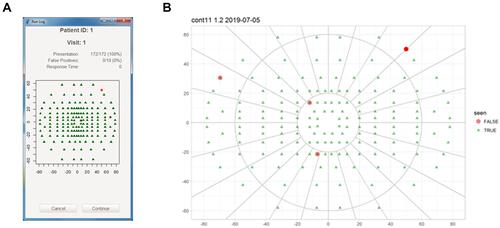
Table 1 Test Characteristics and Parameters Highlighting the Similarities and Differences Between the Original Esterman Test and the Modified Esterman (mET) Test. The Parameters That are Identical are in Cells That Have a Light Grey Background
Table 2 Subject Demographics
Figure 3 Representative examples of the output for the three participant groups from the modified Esterman test with corresponding fundus pictures to demonstrate the disease phenotype. Details of the participant sex and age provided. Black represents locations not seen, dark grey locations were seen on one presentation and light grey locations were seen on both locations.
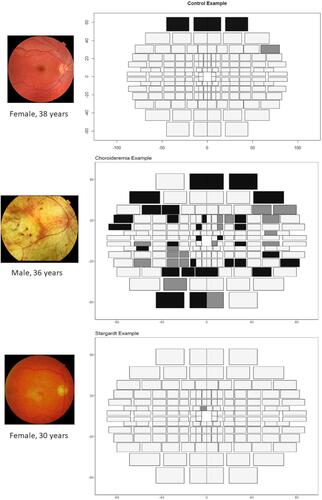
Table 3 Cohen’s Kappa Correlation Estimates
Figure 4 Voronoi tessellation visualisation comparing the Esterman and mET test paradigms across disease severity classifications. Black represents locations not seen, dark grey locations were seen on one presentation and light grey locations were seen on both locations.
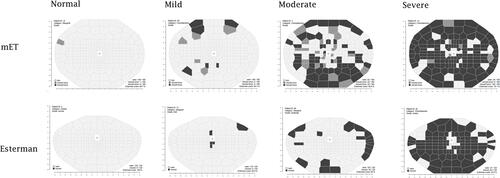
Figure 5 Plot showing the limit of agreement distribution comparing Esterman and mET tests for choroideremia, Stargardt and control patients.
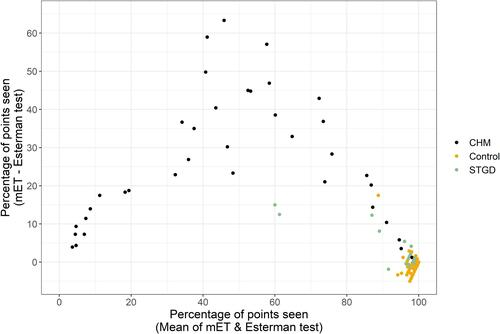
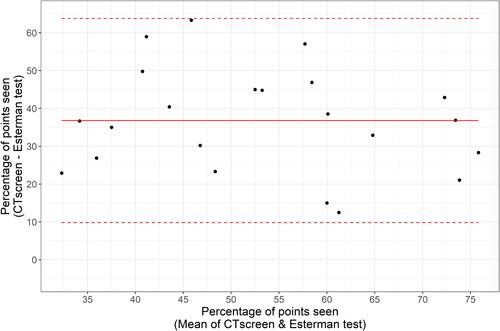
Figure 6 Bland Altman plot showing the limit of agreement comparing Esterman and mET tests for the percentage of points seen between 20% and 80%.