
Figures & data
Table 1 Pre-Operative and Postoperative Questions Used in Regression Analysis
Table 2 Postoperative PRO Outcome Between 2 Groups: Grouped by Postoperative Ratio of ORA/MRC (Stage 1)
Table 3 Postoperative PRO Outcome Between 2 Groups: Grouped by Postoperative Ratio of ORA/MRC, Matched for MRC (Stage 2)
Table 4 Postoperative Refractive Outcome Between 2 Groups: Grouped by Postoperative Ratio of ORA/MRC (Stage 1)
Figure 1 According to our purpose to examine the effect of postoperative ORA we based our grouping method on postoperative ORA. Reproduced with permission from Archer TJ, Reinstein DZ, Pinero DP, Gobbe M, Carp GI. Comparison of the predictability of refractive cylinder correction by laser in situ keratomileusis in eyes with low or high ocular residual astigmatism. J Cataract Refract Surg. 2015;41(7):1383–1392. https://www.sciencedirect.com/science/article/abs/pii/S088633501500838X
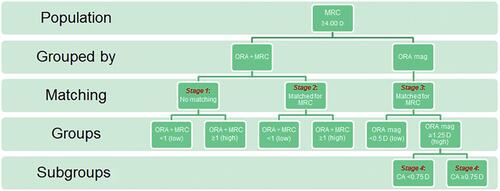
Figure 2 Snellen diagram of the safety index (SI) of stage 1: postoperatively CDVA/ preoperatively CDVA.
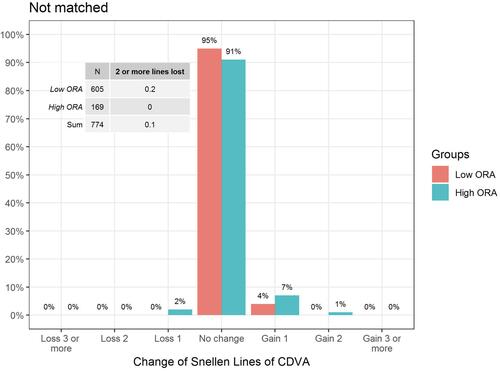
Figure 3 Snellen diagram of the efficacy index (EI) of stage 1: postoperatively UDVA/ preoperatively CDVA.
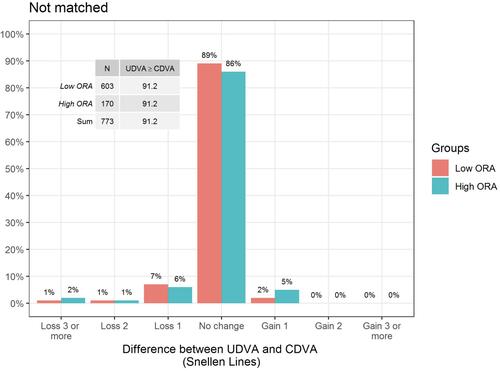
Table 5 Postoperative Refractive Outcome Between 2 Groups: Grouped by Postoperative Ratio of ORA/MRC. Matched for MRC (Stage 2)
Table 6 Postoperative Refractive Outcome Between 3 Groups: Grouped by Postoperative ORA Magnitude, Matched for MRC (Stage 3)
Table 7 Postoperative Safety Index (SI) of All Stages According to Our Method of Grouping
Table 8 Postoperative Efficacy Index (EI) of All Stages According to Our Method of Grouping