Figures & data
Table 1 Demographic Criteria Among Study Participants
Figure 1 Vessel density, perfusion density, and FAZ metric values compared between a healthy control (A, C, E) and a patient with non-proliferative diabetic retinopathy (B, D, F).
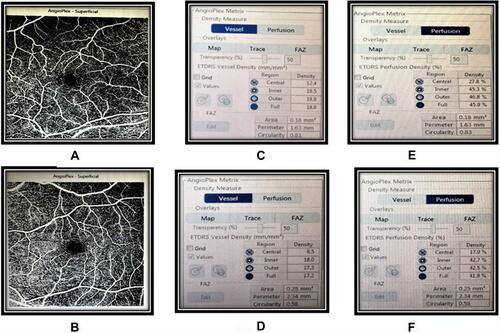
Table 2 Angiographic Values and FAZ Quantitative Parameters of Study Participants in Macula Scans
Table 3 Correlation Between Vessel Density and Perfusion Density and FAZ Parameters Among Patients
Figure 2 Positive fair correlation between inner VD and BCVA in patients.
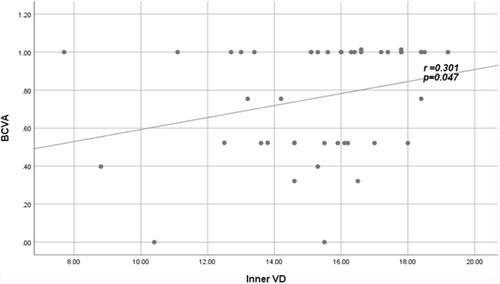
Table 4 Correlations Between Macular Vessel Density, Perfusion Density, and FAZ Parameters with BCVA Among Patients
Figure 3 Positive fair correlation between outer VD and FAZ circularity index in patients.
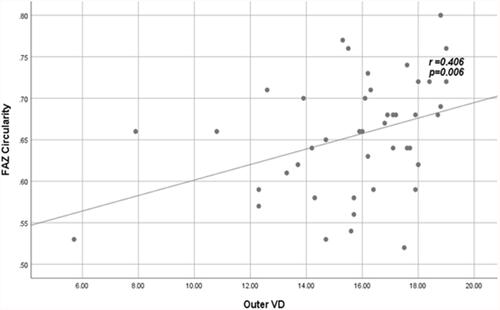
Figure 4 Positive fair correlation between full VD and FAZ circularity index in patients.
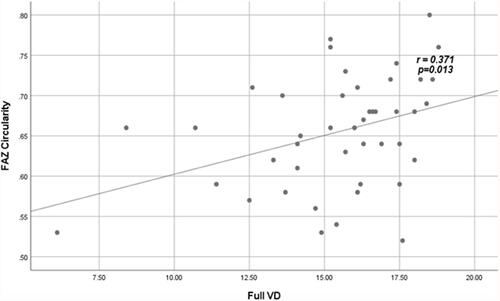
Figure 5 Positive fair correlation between outer PD and FAZ circularity index in patients.
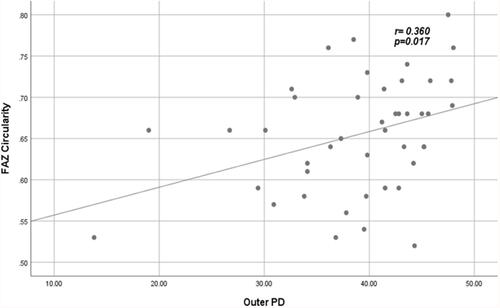
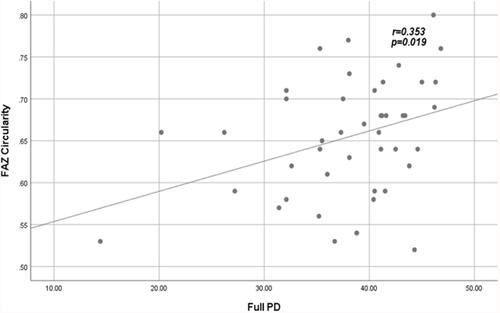
Figure 6 Positive fair correlation between full PD and FAZ circularity index in patients.