
Figures & data
Table 1 Demographics of All Patients and as Categorised by Age (Less Than 45 Years of Age, 45 Years or Older)
Figure 1 Suspected mode of inheritance of inherited retinal disease, based upon genetic test results, family history of inherited retinal disease, or clinicians’ suspected mode of inheritance (as documented). Data presented as n, (%).
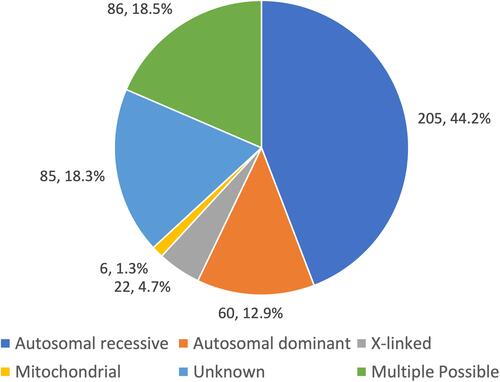
Figure 2 Documented reasons for absence of genetic test results, n (%). Awaiting geneticist and test results indicate patient has been referred for genetic testing, however, has not been seen or has not received results yet. “Not further specified” indicates that counselling regarding genetic testing was not documented on patients’ clinical records. Results presented as n, (%).
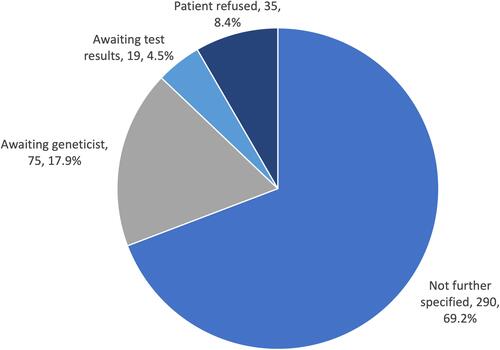
Table 2 Univariate and Multivariate Logistic Regression Assessing Predictors of Having Genetic Testing Results Among Patients
Table 3 Frequency of Genes Identified During Genetic Testing