Figures & data
Figure 1 Typical corneal verticillata showing pigments and haze.
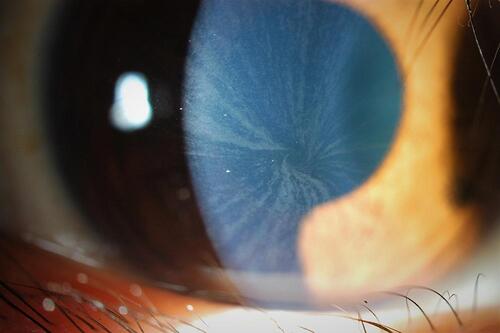
Figure 2 Bulbar conjunctival vessels tortuosities and micro-aneurysms.
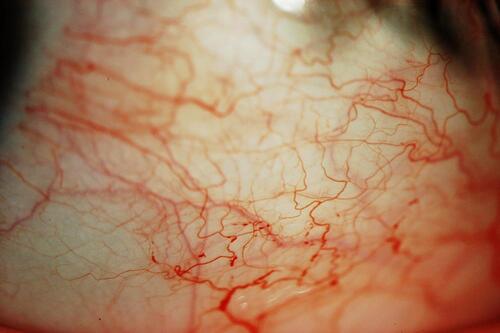
Figure 3 The same blood vessel tortuosities may be seen on the external upper lid.
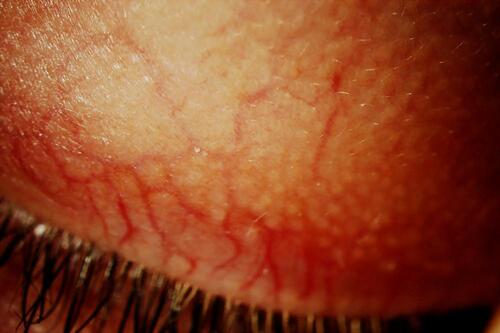
Figure 4 Arterioles and venules showing tortuosities.
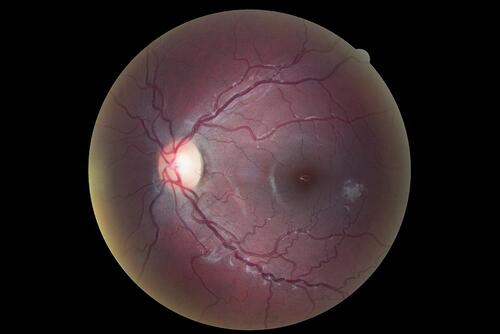
Figure 5 Typical Fabry posterior sub-capsular cataract.
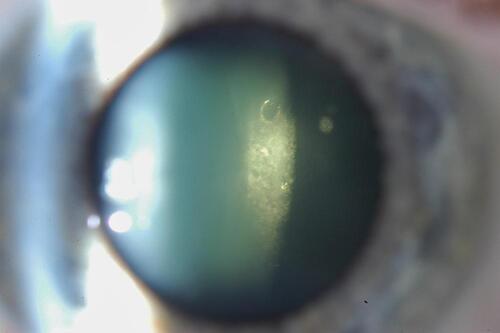
Table 1 Characteristics of the Study Population
Box 1 Description of the ERG System and Strategy Used
Table 2 Results from the Optic Nerve Head Scanning
Table 3 Visual Field Testing (SAP) Results
Table 4 FDT Results
Figure 6 (A–D) Evolution of the visual field defects. (A) Patient A OD year 1- no defect; (B) patient A OD year 2- defect in 3 quadrants; (C) patient B OS year 1 - defect in 4 quadrants; (D) patient B OS year 2 – defect in 3/4 quadrants but more severe.
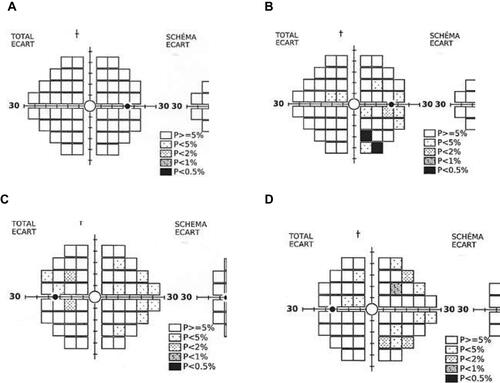
Table 5 Responses to a Flash, Under Photopic Conditions
Table 6 Amplitude of pnHR Vs Stimulus Intensity
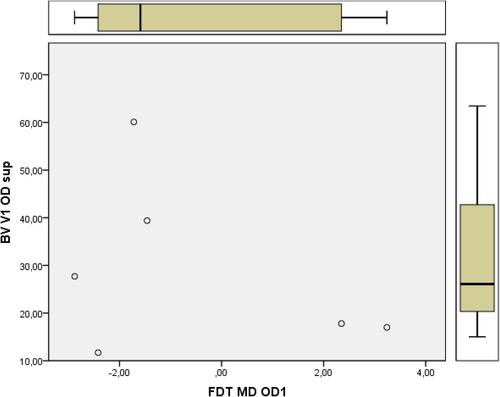
Figure 7 Example of a typical graph showing the relationship between PSD and blood volume.
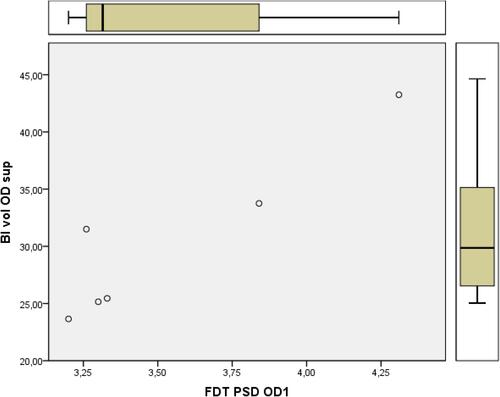
Figure 8 Example of a typical graph showing the relationship between MD and blood volume.