Figures & data
Table 1 Age, Clinical Characteristics, SAP Parameters and OCT Parameters in Both Groups
Table 2 Photopic ERG Parameters in Both Groups
Table 3 PhNR Measurements Among the Control Group and the Three Glaucoma Subgroups
Figure 1 Photopic electroretinograms with measurements (latency and BT amplitude) of PhNR in (A) a control, (B) a mild glaucoma case, (C) a moderate glaucoma case and (D) a severe glaucoma case.
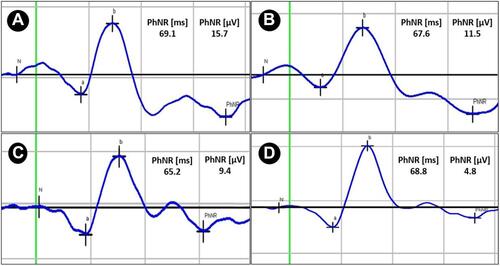
Table 4 Correlation of PhNR Measurements with Age, SAP Parameters and OCT Parameters in the Study Group
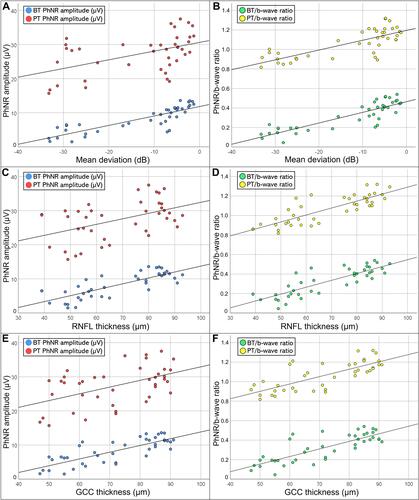
Figure 2 Scatter plots showing the correlation of PhNR measurements with (A and B) Mean deviation, (C and D) RNFL thickness and (E and F) GCC thickness in the study group.