
Figures & data
Table 1 Demographic and Diabetes Related Data per Group (G1/G2) and Quartile (Q1/Q3)
Table 2 Functional and Morphological Data per Group (G1/G2) and Quartile (Q1/Q3)
Table 3 Pearson’s Correlation Coefficient PCC and p-values for Regression Analysis
Figure 1 Mean FAZ versus high contrast visual acuity score (Pearson’s correlation coefficient −0.38; p=0.03).
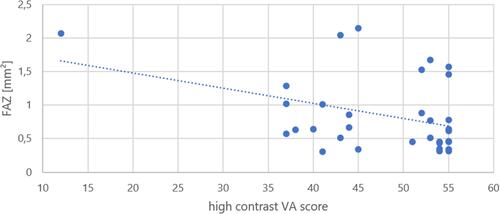
Figure 2 Mean FAZ versus low contrast visual acuity score (Pearson’s correlation coefficient −0.41; p=0.02).
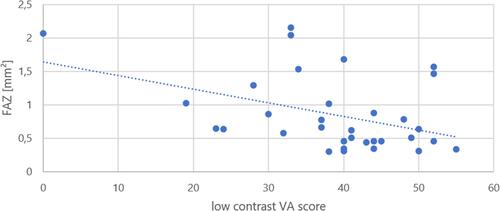
Figure 3 Mean FAZ versus total macular volume [mm3] (Pearson’s correlation coefficient 0.35; p=0.04).
![Figure 3 Mean FAZ versus total macular volume [mm3] (Pearson’s correlation coefficient 0.35; p=0.04).](/cms/asset/1f7cebb1-7adf-4a54-949f-ff3caf5c33cd/doph_a_358467_f0003_c.jpg)