
Figures & data
Figure 1 Schirmer test I at right eye of female patient that showed value of less than 15mm at 1st week postoperative.
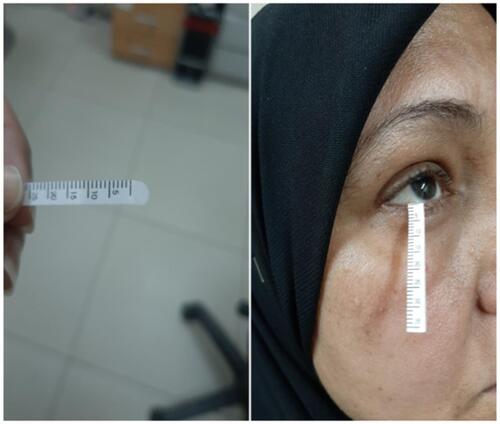
Figure 2 TBUT of right eye of male patient, that showed normal result more than 10 sec preoperative and abnormal result less than 10 sec only at 1st week postoperative.
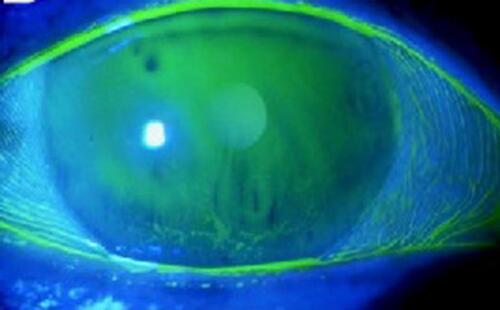
Table 1 Demographic Data of the Studied Population
Table 2 Pre-Operative Assessment of Eye Dryness
Table 3 Patients’ Sequential Changes in Dry Eye Tests Over Time; (N= 100)
Table 4 Comparison of P-values for Patients’ Sequential Changes in Dry Eye Tests Over Time; (N= 100)
Table 5 Frequency of Post-Operative Dry Eye
Table 6 Association Between Gender and Eye Dryness
Table 7 Association of Age and Postoperative Dry Eye
Table 8 Correlation Between Post Phacoemulsification Dry Eye Assessment and Patients’ Age