Figures & data
Table 1 Baseline Pachymetry and Changes from Baseline to Follow-Up Time Points. Means, Minimum, Maximum, Standard Deviation (SD), and Standard Error of the Mean (SE) are Expressed in Microns. The 95% Confidence Interval is Given for the Pachymetry Results Where Distributions Appeared Normal (at Month 6 and Month 12 Post-Op)
Figure 1 The means of pachymetry changes from baseline do not vary significantly from zero (p > 0.4).
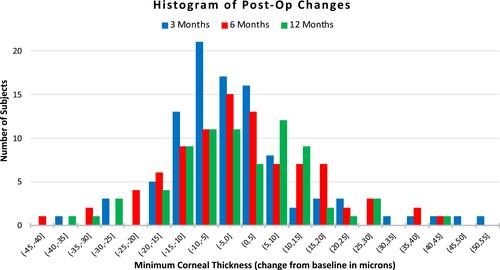
Figure 2 Histograms of post-operative pachymetry changes are superimposed. Blue, red, and green bars show the distribution of changes from baseline to the 3-, 6-, and 12-month post-op follow up time points.
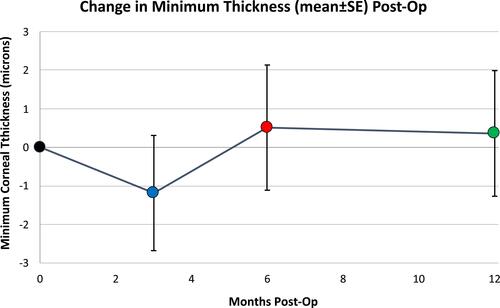
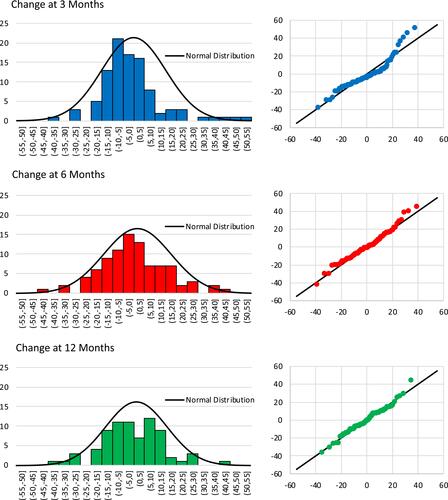
Figure 3 Distributions of change from baseline to 3 months (top), 6 months (middle) and 12 months (bottom) post-op. Q-Q plots (at right) for each distribution show quantiles vs that of a Gaussian distribution of best fit. Only the 3-month post-op distribution departs from normalcy. The 6- and 12-month post-op distributions appear approximately normal.