
Figures & data
Table 1 Demographic and Study Characteristics
Figure 1 Exclusion criteria and model structure.
Abbreviations: POAG, primary open-angle glaucoma; HTN, hypertension; DM2, type 2 diabetes.
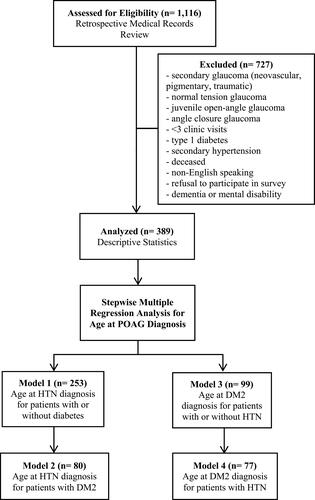
Table 2 Mean Age at POAG Diagnosis Between Cohorts: History of Migraine and No History of Migraine
Table 3 Mean Age at POAG Diagnosis Between Cohorts: History of OSA and No History of OSA
Table 4 Mean Age at POAG Diagnosis Between Cohorts: HTN Only, DM2 Only, HTN and DM2, and Neither HTN nor DM2
Table 5 Results of Stepwise Regression Analysis of Age at POAG Diagnosis for Models 1–4