Figures & data
Table 1 Criteria of Studied Cases
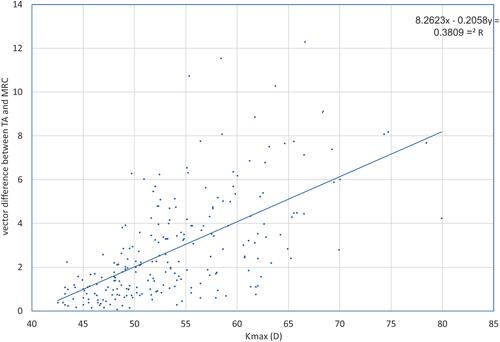
Figure 1 Correlation between power of topographic corneal astigmatism and manifest refractive astigmatism.
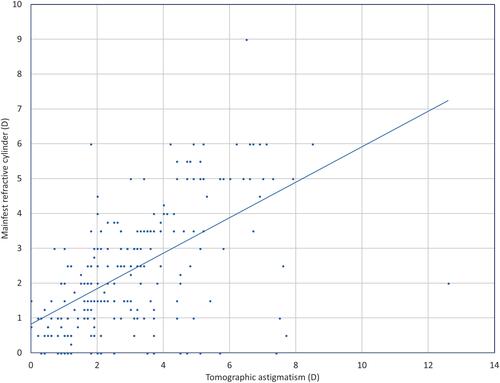
Figure 2 Correlation between axis of topographic corneal astigmatism (TA) and manifest refractive astigmatism (MRC).
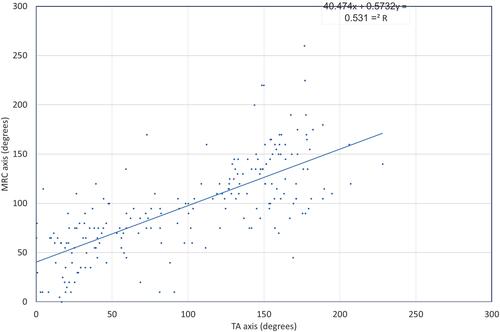
Figure 3 Polar plot of astigmatism power and axis of studied cases; right eyes (OD) above and left eyes (OS) below.
Abbreviations: TA, topographic astigmatism (blue triangles); MRC, manifest refractive cylinder (red triangles) showing more vertical orientation of MRC in comparison of TA.
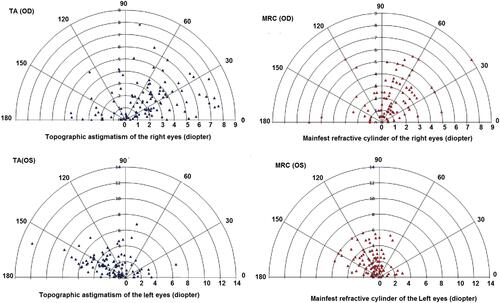
Table 2 Difference Between Axis of Tomographic Astigmatism (TA) and Manifest Refractive Cylinder (MRC) and Results of Vector Analysis
Figure 4 Correlation between Kmax (D) and vector difference between topographic and manifest astigmatism.