
Figures & data
Table 1 Clinical Characteristics of the 20 Cases
Table 2 Treatment for Idiopathic Orbital Inflammation
Figure 1 Changes in IOP before and after treatment. IOP is shown on the vertical axis. After treatment, IOP decreased significantly. *p = 0.009.
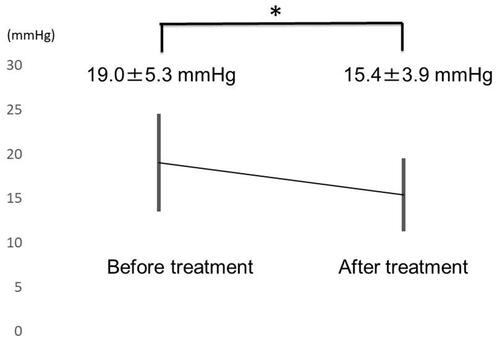
Figure 2 IOP by inflammatory site. IOP is shown on the vertical axis. The type of idiopathic orbital inflammation is shown on the horizontal axis. *p < 0.05 Dacryoadenitis vs Diffuse type.
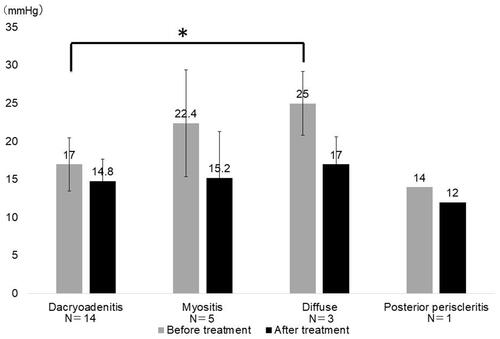
Figure 3 Percentage of high IOP before treatment by inflammation site. The percentage is shown on the vertical axis. The type of idiopathic orbital inflammation is shown on the horizontal axis.
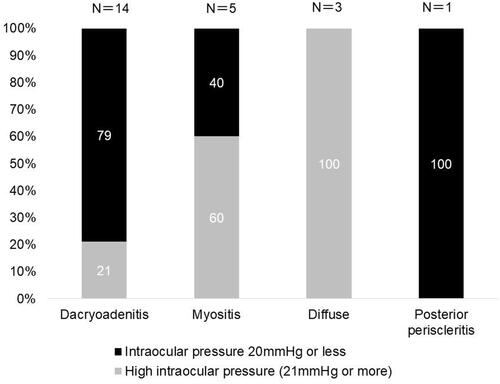
Table 3 Ocular Symptoms Prior to Treatment of Idiopathic Orbital Inflammation