
Figures & data
Table 1 Demographic Information of the Entire Patient Cohort
Table 2 Comparison of the Preoperative and Postoperative CXL Intraocular Pressure Values and Uncorrected Distance Visual Acuity and Corrected Distance Visual Acuity
Table 3 Comparison of the Preoperative and Postoperative CXL SBT Parameters
Table 4 Comparison of the Preoperative and Postoperative CXL AS-OCT Parameters
Table 5 Multiple Regression Analysis Investigating Factors Affecting the Changes in the Preoperative and Postoperative CXL SBT Parameters
Figure 1 Correlation between Δcorneal biomechanical parameters and other parameters. A moderate positive correlation was found between the Δdeformation amplitude (DA) ratio max (2 mm) and age (A) (R=0.305, p=0.044). No significant correlation was found between the ΔDA Ratio Max (2 mm) and Δaverage K (B) (R=0.228, p=0.137). No significant correlation was found between the ΔDA Ratio Max (2 mm) and Δthinnest (C) (R=−0.265, p=0.083). A moderate positive correlation was found between the Δstiffness parameter at applanation 1 (SP-A1) and Δintraocular pressure (IOP) (D) (R=0.332, p=0.028). A moderate positive correlation was found between the Δstress-strain index (SSI) and ΔIOP (E) (R=0.308, p=0.042).
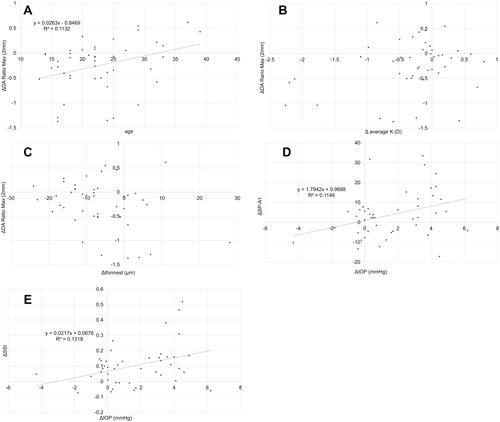
Figure 2 Correlation between each anterior segment optical coherence tomography (AS-OCT) parameter change and Δintegrated radius. No significant correlation was found between the change in each AS-OCT parameter and Δintegrated radius. ((A) Δaverage K, R=0.071, p=0.648) ((B) Δsteep K, R=0.147, p=0.342) ((C) Δcylinder, R=0.117, p=0.449) ((D) Δmaximum keratometry [Kmax], R=0.180, p=0.242) ((E) Δthinnest, R=−0.138, p=0.370).
![Figure 2 Correlation between each anterior segment optical coherence tomography (AS-OCT) parameter change and Δintegrated radius. No significant correlation was found between the change in each AS-OCT parameter and Δintegrated radius. ((A) Δaverage K, R=0.071, p=0.648) ((B) Δsteep K, R=0.147, p=0.342) ((C) Δcylinder, R=0.117, p=0.449) ((D) Δmaximum keratometry [Kmax], R=0.180, p=0.242) ((E) Δthinnest, R=−0.138, p=0.370).](/cms/asset/b3648d78-9b20-441f-9e95-0ed38b4a66b8/doph_a_361836_f0002_b.jpg)
Figure 3 Correlation between each anterior segment optical coherence tomography (AS-OCT) parameter change and Δ maximum (Max) inverse radius. No significant correlation was found between the change in each AS-OCT parameter and ΔMax inverse radius. ((A) Δaverage K, R=0.027, p=0.863) ((B) Δsteep K, R=0.029, p=0.854) ((C) Δcylinder, R=0.017, p=0.912) ((D) Δ maximum keratometry [Kmax], R=0.025, p=0.872) ((E) Δthinnest, R=−0.147, p=0.340).
![Figure 3 Correlation between each anterior segment optical coherence tomography (AS-OCT) parameter change and Δ maximum (Max) inverse radius. No significant correlation was found between the change in each AS-OCT parameter and ΔMax inverse radius. ((A) Δaverage K, R=0.027, p=0.863) ((B) Δsteep K, R=0.029, p=0.854) ((C) Δcylinder, R=0.017, p=0.912) ((D) Δ maximum keratometry [Kmax], R=0.025, p=0.872) ((E) Δthinnest, R=−0.147, p=0.340).](/cms/asset/068f5a7f-6423-47a6-b5d1-fa8547c45a30/doph_a_361836_f0003_b.jpg)
Figure 4 Correlation between each anterior segment optical coherence tomography (AS-OCT) parameter change and ΔDA ratio max (2 mm). No significant correlation was found between the change in each AS-OCT parameter and Δ deformation amplitude (DA) ratio max (2 mm). ((A) Δaverage K, R=0.228, p=0.137) ((B) Δsteep K, R=0.196, p=0.201) ((C) Δcylinder, R=0.075, p=0.628) ((D) Δ maximum keratometry [Kmax], R=0.216, p=0.159) ((E) Δthinnest, R=−0.265, p=0.083).
![Figure 4 Correlation between each anterior segment optical coherence tomography (AS-OCT) parameter change and ΔDA ratio max (2 mm). No significant correlation was found between the change in each AS-OCT parameter and Δ deformation amplitude (DA) ratio max (2 mm). ((A) Δaverage K, R=0.228, p=0.137) ((B) Δsteep K, R=0.196, p=0.201) ((C) Δcylinder, R=0.075, p=0.628) ((D) Δ maximum keratometry [Kmax], R=0.216, p=0.159) ((E) Δthinnest, R=−0.265, p=0.083).](/cms/asset/5a974bf3-63a4-4b7f-a2b6-95bb23e27b30/doph_a_361836_f0004_b.jpg)
Figure 5 Correlation between each anterior segment optical coherence tomography (AS-OCT) parameter change and Δ stiffness parameter at applanation 1 (SP-A1). No significant correlation was found between the change in each AS-OCT parameter and ΔSP-A1. ((A) Δaverage K, R=−0.030, p=0.848) ((B) Δsteep K, R=−0.038, p=0.805) ((C) Δcylinder, R=−0.018, p=0.905) ((D) ΔKmax, R=−0.028, p=0.858) ((E) Δthinnest, R=0.47, p=0.762).
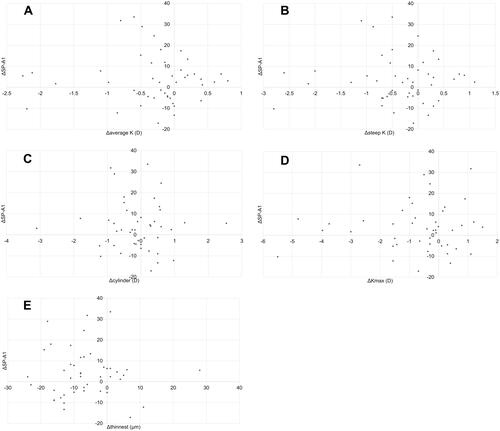
Figure 6 Correlation between each anterior segment optical coherence tomography (AS-OCT) parameter change and Δ stress-strain index (SSI). No significant correlation was found between the change in each AS-OCT parameter and ΔSSI. ((A) Δaverage K, R=−0.036, p=0.818) ((B) Δsteep K, R=−0.022, p=0.888) ((C) Δcylinder, R=−0.017, p=0.913) ((D) Δ maximum keratometry [Kmax], R=−0.111, p=0.474) ((E) Δthinnest, R=0.38, p=0.806).
![Figure 6 Correlation between each anterior segment optical coherence tomography (AS-OCT) parameter change and Δ stress-strain index (SSI). No significant correlation was found between the change in each AS-OCT parameter and ΔSSI. ((A) Δaverage K, R=−0.036, p=0.818) ((B) Δsteep K, R=−0.022, p=0.888) ((C) Δcylinder, R=−0.017, p=0.913) ((D) Δ maximum keratometry [Kmax], R=−0.111, p=0.474) ((E) Δthinnest, R=0.38, p=0.806).](/cms/asset/f41c3926-1f2f-4585-b870-24b4be98df7d/doph_a_361836_f0006_b.jpg)