
Figures & data
Table 1 Baseline Characteristics of Eyes That Had LASIK and PRK
Table 2 Baseline IOP of Eyes That Had LASIK and PRK
Table 3 Pearson Correlation Analysis of Preoperative Mean IOP Measurements Between 2 Tonometers (Tonometer Pairs)
Figure 1 Bland Altman analysis of the difference in preoperative IOP measurements of tonometer pairs (A and B) GAT-CATS, (C and D) GAT-CVS-bIOP and (E and F) CATS-CVS-bIOP in LASIK and PRK.
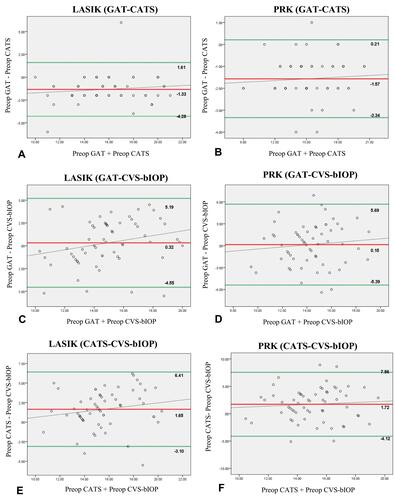
Table 4 Changes in IOP Before and After LASIK or PRK
Table 5 Pearson Correlation Analysis of Preoperative and Postoperative Measurements of Each Tonometer
Figure 2 Bland Altman analysis of the difference in preoperative and postoperative IOP measurements per tonometer (A and B) GAT, (C and D) CATS and (E and F) CVS-bIOP in LASIK and PRK.
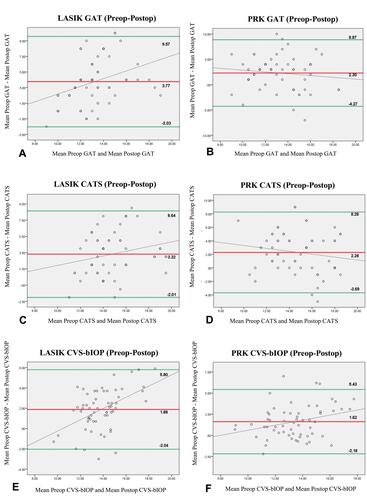
Table 6 Pearson Correlation Analysis of Postoperative Mean IOP Measurements Between 2 Tonometers (Tonometer Pairs)
Table 7 Pearson Correlation Analysis of Percentage Change (%Δ) Before and After LASIK and PRK Between 2 Tonometers (Tonometer Pairs)
Table 8 Changes in MRSE, CCT and Km Before and After LASIK and PRK
Table 9 Percentage Change (%Δ) in MRSE, CCT and Km Before and After LASIK or PRK (Inter)
Table 10 Pearson Correlation Analysis Between Percentage Change (%Δ) in IOP Measurements versus Percentage Change (%Δ) in MRSE, CCT and Km in LASIK and PRK