
Figures & data
Table 1 Characteristics of the Patients and Implanted Intraocular Lenses
Table 2 Prediction Error of Intraoperative Aberrometry
Figure 1 Box and whisker plots of the numerical (A) and absolute (B) errors of intraoperative aberrometry in eyes with target of emmetropia and intentional myopia. The horizontal line in the box represents the median. The top and bottom of the box represent the upper and lower quartiles respectively. The whisker above the box represents the values within 1.5 times the of interquartile range plus the upper quartile. The whisker below the box represents the values within 1.5 times of the interquartile range minus the lower quartile. Values, which are not included between whiskers were plotted as outliers.
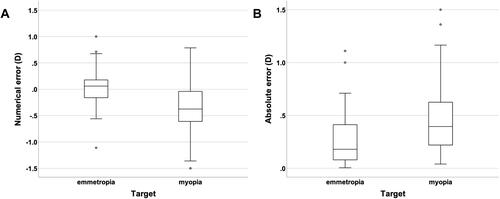
Table 3 Comparison Between Accuracy of Intraoperative Aberrometry and Intraocular Lens Calculation Formulas in 39 Eyes with Target of Emmetropia
Table 4 Comparison Between Accuracy of Intraoperative Aberrometry and Intraocular Lens Calculation Formulas in 22 Eyes with Target of Intentional Myopia