Figures & data
Figure 1 Schematic diagram illustrating angle kappa and the proxy vector from an eye image.
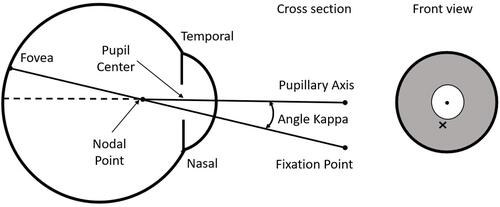
Figure 2 Image and angle kappa calculation from the OPD-Scan III.
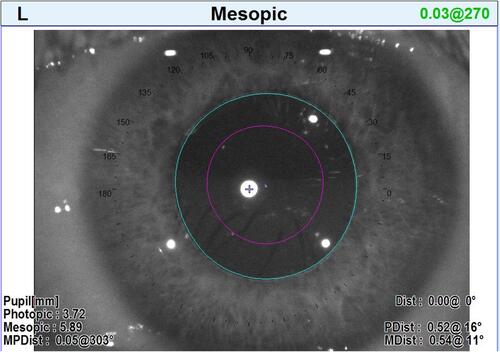
Table 1 Demographic, Biometric and Operative Details (28 Subjects, 56 Eyes)
Table 2 Summary of Postoperative Refractive and VA Outcomes
Figure 3 Frequency of visual disturbances reported. *Negative dysphotopsia.
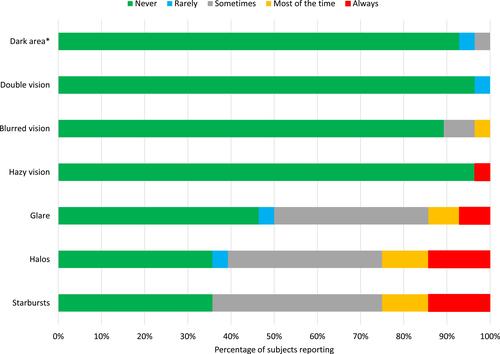
Figure 4 Frequency of starbursts (top), halos (middle) and glare (bottom) by categorical magnitude of angle kappa.
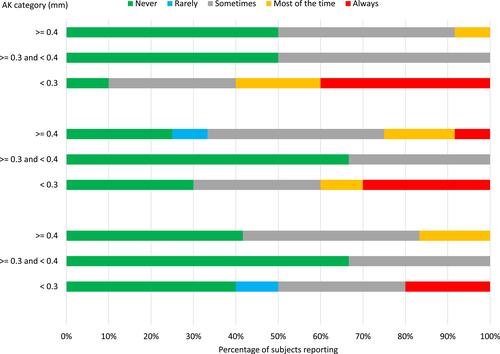
Table 3 Reported Ability to See at Various Distances in Dim and Bright Light
Table 4 Change in AK Categorization After Surgery
Table 5 Preoperative and Postoperative AK Centroid Values by Eye
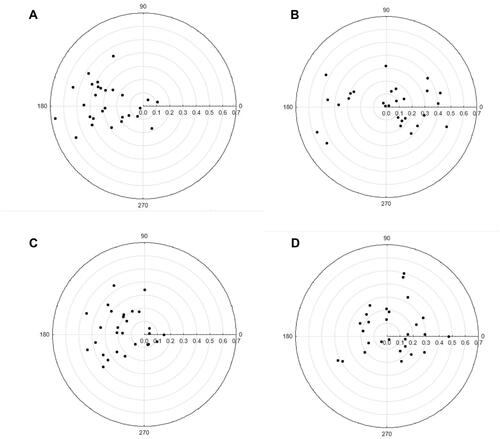
Figure 5 Distribution of angle kappa vectors by eye, preoperative and postoperative (radial scale in mm). (A) preoperative OD, (B) preoperative OS, (C) postoperative OD, (D) postoperative OS.