
Figures & data
Table 1 Patient Demographic Data
Table 2 Results of the CBC Investigations
Table 3 Results of the Anti-HIV, CXR, and EKG Investigations
Figure 1 Bar graph shows the number of patients who had abnormal preoperative laboratory results that required additional management.
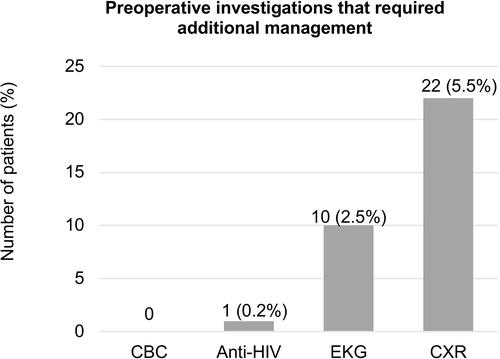
Table 4 Cancellation or Postponement of Surgery
Figure 2 Bar graph showing numbers of patients who cancelled/postponed surgery due to the results of the preoperative investigations.
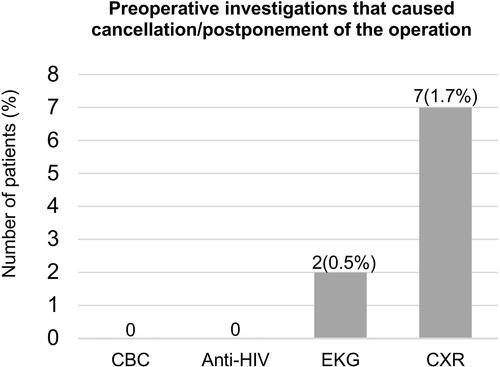
Table 5 Results of the Univariate Analysis of Risk Factors Associated with Abnormal Preoperative EKG and Cancellation or Postponement of the Operation
Table 6 Results of the Univariate Analysis of Risk Factors Associated with Specific Abnormal Preoperative CXR and Cancellation or Postponement of the Operation