Figures & data
Table 1 Glaucoma Biomarker Gene Catalogue
Table 2 (VL-) Log2 Fold-Changes in Poly I:C-Responsive Glaucoma Biomarker Genes
Table 3 Comparison of the Fold-Changes from the (VL-) and (VL+) Groups
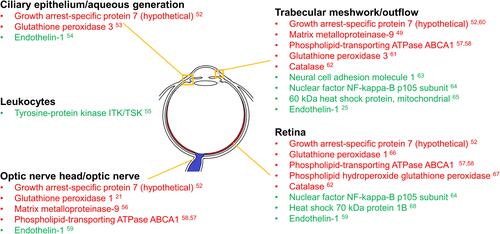
Figure 1 Regions of the eye expressing glaucoma biomarker genes found to be responsive to Poly(I:C) challenge in peripheral blood samples. Regions of the eye are listed along with the encoded proteins likely to affect them from the differentially expressed genes identified in . Differentially expressed genes were detected using microarray analysis of PBMCs taken from human blood samples of patients infected with HCV and then challenged with poly(I:C). Red indicates decreased PBMC gene expression compared to baseline in response to poly(I:C) challenge, while green indicates increased expression compared to baseline. Please note that the expression levels were not found in the regions indicated in the figure and do not represent them. That is beyond the scope of the current study. The regional classifications demonstrate areas where glaucoma-related immune response genes/proteins may be investigated in future studies.