Figures & data
Table 1 Initial Filtering of Vestrum Dry AMD Database
Table 2 Variables Used to Perform Propensity Score Matching
Table 3 Demographics by Study Group, After Propensity Score Matching
Table 4 Follow-Up and Treatment Summary by Study Group, After Propensity Score Matching
Table 5 Kaplan-Meier Test Between Groups, Stratified by Propensity Score Quintiles
Table 6 Summary of Overall Survival by Group (Summary of Hazard Ratio Between the Two Groups (Unstratified Kaplan–Meier Estimates), SCA (Standard Care Alone) vs VPT (Vision Protection Therapy)
Figure 1 Cumulative probability of neovascular AMD conversion by propensity score strata. The survival analysis was stratified by propensity score quintiles. That is, eyes were divided into five (nearly equal size) groups using the quintiles of the propensity scores, from lowest (1st quintile) to highest (5th quintile) risk. The plots show the survival curves by propensity score stratum. Note that for every risk factor matched quintile, VPT appears to significantly reduce the rate of neovascular conversion compared to standard care alone. Note that the apparent advantage of VPT is greatest for eyes in the highest risk (5th) quintile.
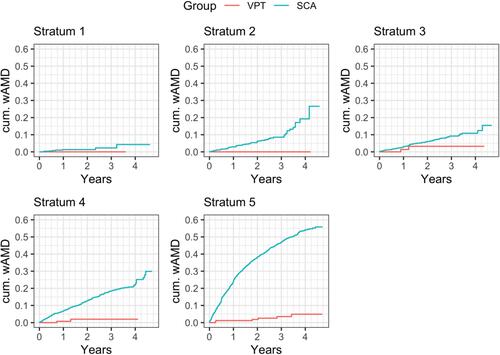
Figure 2 Summary of Survival Fits. Overall Kaplan-Meier cumulative wet AMD conversion probability by group, SCA vs VPT. Shaded areas indicate 95% confidence intervals. This graphic illustrates that VPT reduced the risk of neovascular conversion in dry AMD by a hazard ratio of 13.04. Thus, Vision Protection Therapy treated eyes were 13.04 times less likely each day to develop neovascular AMD than eyes managed with standard care alone.
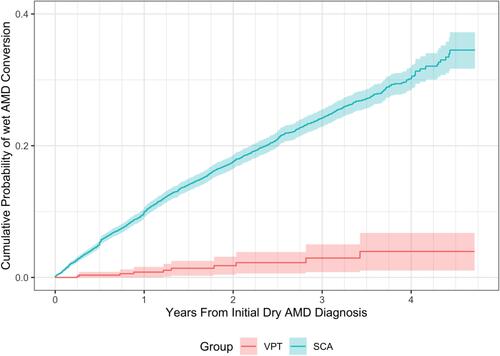
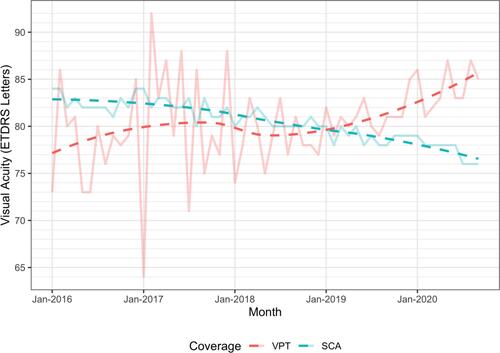
Figure 3 Visual acuity by month over time, SCA and SC+SDM (VPT) Groups, with loess smooths. Plot shows the mean VA per month for the SCA and VPT subjects. As expected, there is more noise in the much smaller VPT group. Given the amount of noise it is difficult to assess whether there are any differences in VA through time.