Figures & data
Figure 1 Trends in the volume of cataract surgeries performed according to the Thai national data before and during the COVID-19 pandemic. Large arrow: lockdown phase. Small arrow: after lockdown was lifted. Chevron: start of the second wave.
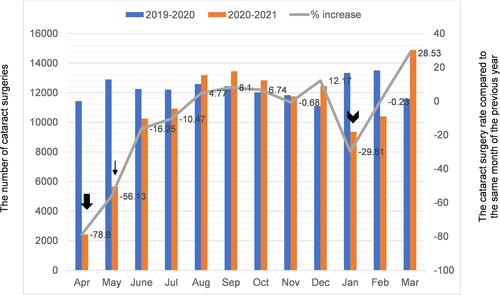
Figure 2 Trends in cataract surgery performed during the study period as compared to the pre-pandemic volume. Large arrow: lockdown phase. Small arrow: after lockdown was lifted. Chevron: start of the second wave.
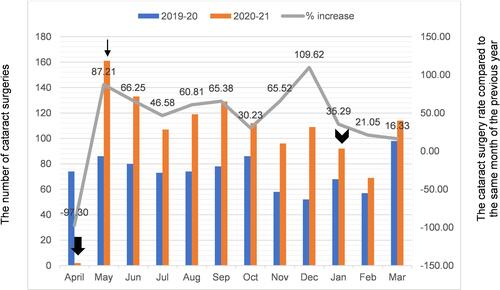
Figure 3 Flow diagram of patients who underwent cataract surgery during the study period.
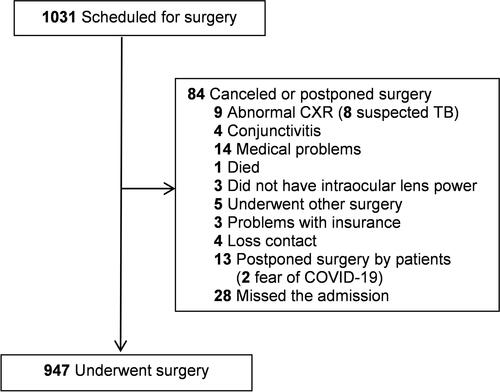
Table 1 Best-Corrected Visual Acuity Outcome from COVID-19 Pandemic Period and Pre-COVID-19 Pandemic Period
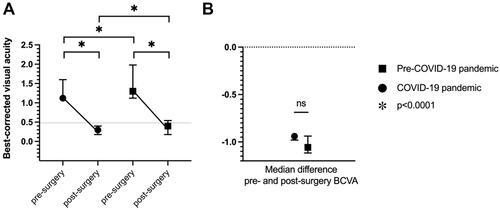
Figure 4 (A) Comparison of baseline best-corrected visual acuity (BCVA) and postoperative BCVA between the pre-COVID-19 period and during the COVID-19 pandemic. (B) Comparison of the median difference between pre- and postoperative BCVA between the pre-COVID-19 period and during the COVID-19 pandemic. Triangle: pre-COVID-19 pandemic. Circle: COVID-19 pandemic. Asterisk: p<0.0001.