
Figures & data
Table 1 Epidemiological Data
Figure 1 Change in visual acuity (ETDRS scores; 85 ETDRS letters represent a Snellen decimal visual acuity of 1.0) over time after macular hole surgery in relation to macular hole size. Median and interquartile ranges are displayed in parentheses after means and standard deviations. Significant differences (p<0.01) are marked with a *. Differences were found between group 1 (<250µm) and group 3 (>402µm). n: sample size; µm: micrometer.
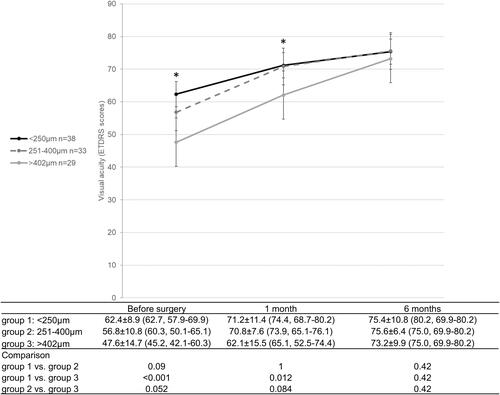
Table 2 Closure Pattern
Table 3 Closure Pattern and Visual Acuity (Measured in ETDRS Letters)
Table 4 Sensitivity and Defect
Table 5 Fixation Stability in the 2° and 4° Visual Field in Microperimetry
Data Availability Statement
Data are available at: http://augenklinik-bern.ch/research/Data_Wons_et_al_2021.xlsx.