Figures & data
Table 1 Demographic and Baseline Glaucoma Status of Study Participants
Table 2 Mean IOP and Medication Use at Each Study Visit
Figure 1 Mean IOP over time in the study cohort. Error bars represent standard deviation. Reductions from baseline were significant (p<0.05) at every time point.
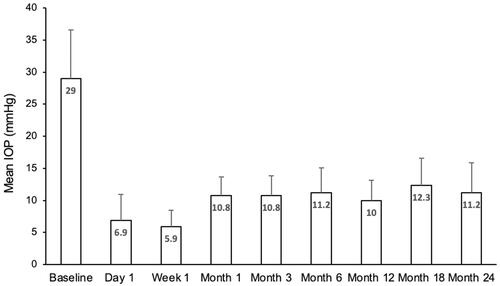
Table 3 Secondary Outcome Measures at Last Mean Follow-Up (n = 12 Eyes)
Figure 2 Mean medication use over time in the study cohort. Error bars represent standard deviation. Reductions from baseline were significant (p<0.05) at every time point.
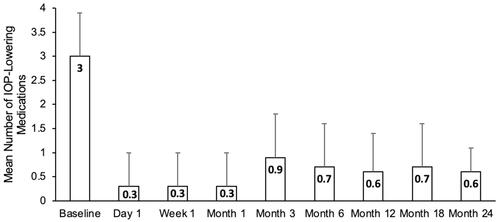
Table 4 The Nature and Frequency of Postoperative Complications (n = 12 Eyes)
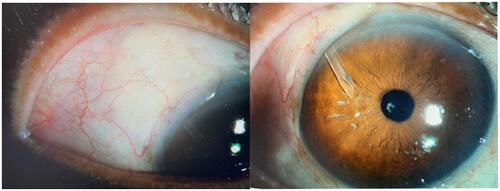
Figure 3 A shallow, diffuse bleb was observed in all eyes (n = 12) at the 24-month follow-up visits.