Figures & data
Figure 1 Scatter plot of attempted versus achieved correction of manifest refraction spherical equivalent, demonstrating the full range of refractive correction.
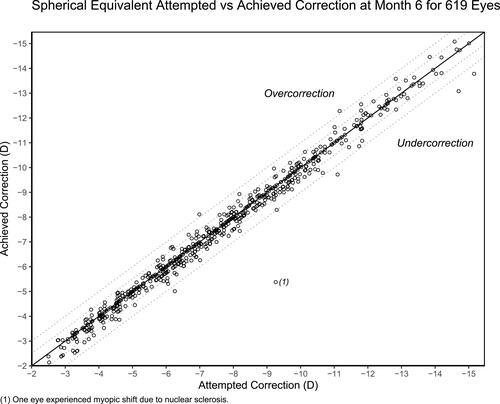
Table 1 Preoperative Characteristics
Figure 2 Accuracy of spherical equivalent refractive correction at Month 6. 90.5% of eyes were within ± 0.50 D and 98.9% of eyes were within ± 1.00 D of emmetropia.
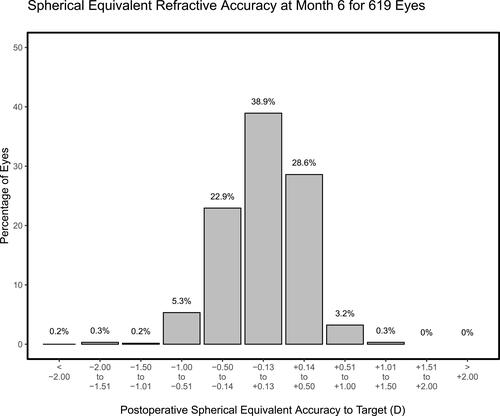
Figure 3 The stability of the spherical equivalent refraction from Month 1 to Month 6 is demonstrated in the consistent cohort of 617 eyes with data at all time points.
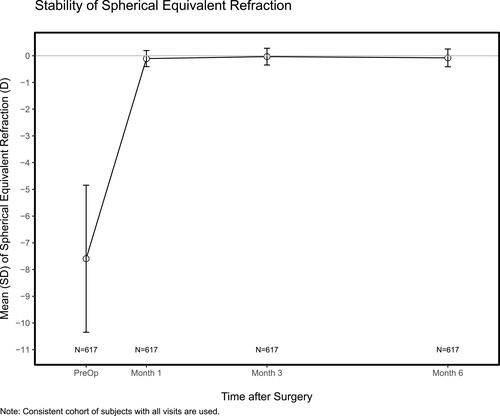
Figure 4 Frequency distribution of uncorrected visual acuity at Month 6. All visual acuity testing was performed using an ETDRS chart and values were converted from logMAR to Snellen.
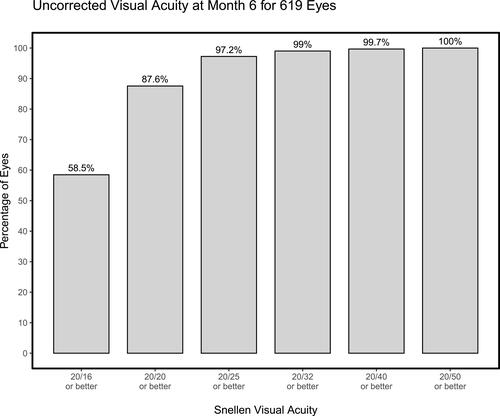
Figure 5 Lines of corrected distance visual acuity gained or lost. 52.3% of eyes gained lines of CDVA and 98.5% of eyes demonstrated CDVA at 6 months equal to or better than preoperative CDVA.
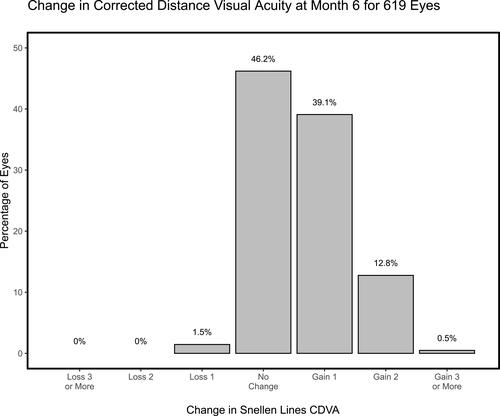
Figure 6 Mean postoperative intraocular pressure remained stable from Day 1 through Month 6.
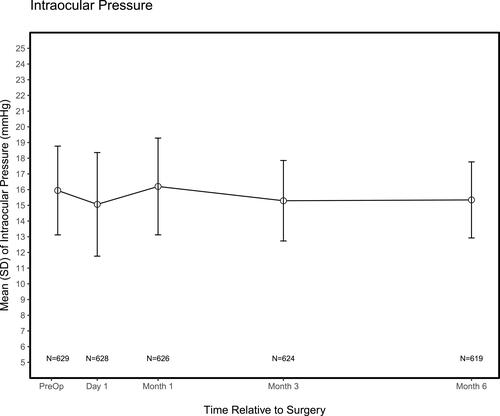
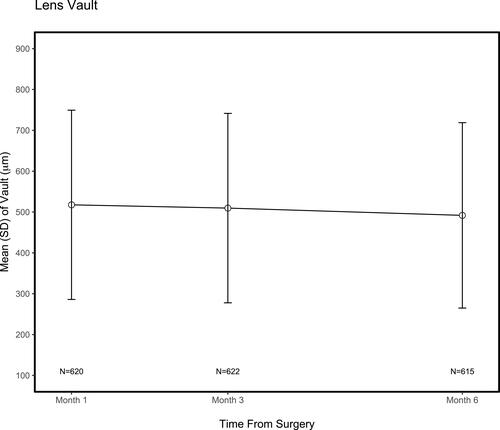
Figure 7 Vault measurements were consistent with values previously reported in the published literature.