Figures & data
Table 1 General Characteristics of the Studied Groups
Table 2 Intraocular Pressure Before and After Injection
Figure 1 Intraocular pressure before and after anesthesia injection in both groups.
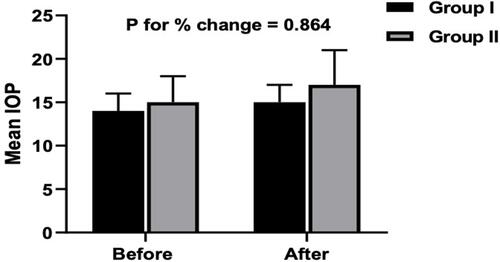
Figure 2 OCT-A of the DCP in patient number 4 in group II before injection of peribulbar anesthesia.
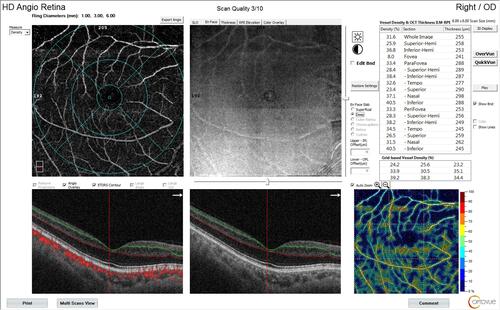
Figure 3 OCT-A of the DCP of patient number 4 in group II after injection of peribulbar anesthesia.
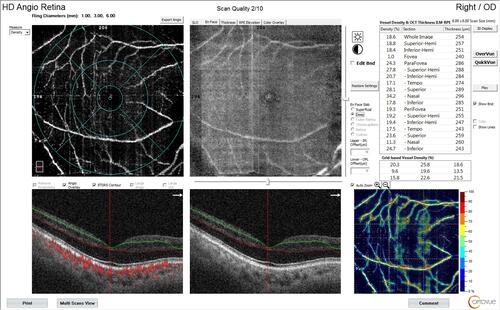
Figure 4 OCT-A of the FAZ of patient number 4 in group II before injection of peribulbar anesthesia.
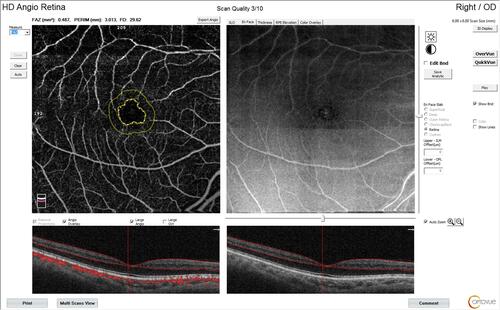
Figure 5 OCT-A of the FAZ of patient number 4 in group II after injection of peribulbar anesthesia.
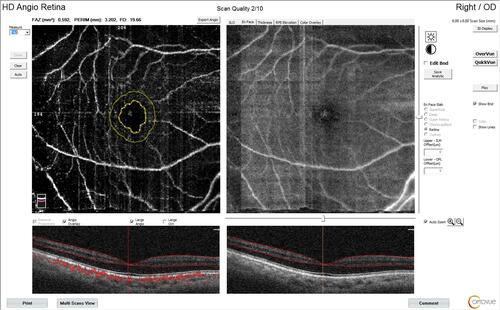
Figure 6 OCT-A of the ONH and peripapillary area of patient number 6 in group I before injection of peribulbar anesthesia.
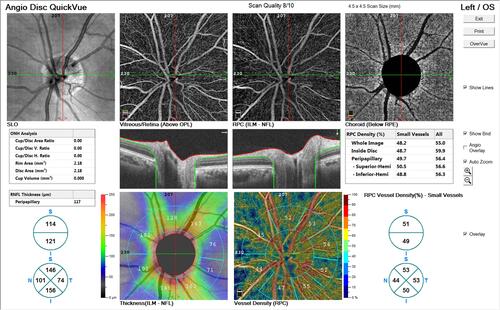
Figure 7 OCT-A of the ONH and peripapillary area of patient number 6 in group I after injection of peribulbar anesthesia.
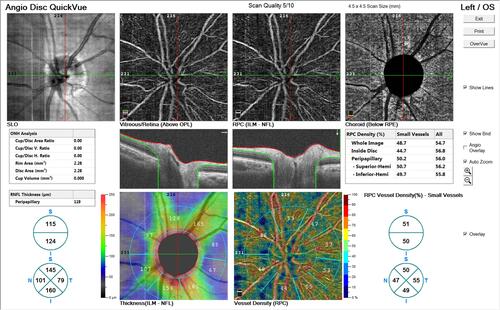
Figure 8 OCT-A of the ONH and peripapillary area of patient number 4 in group II before injection of peribulbar anesthesia.
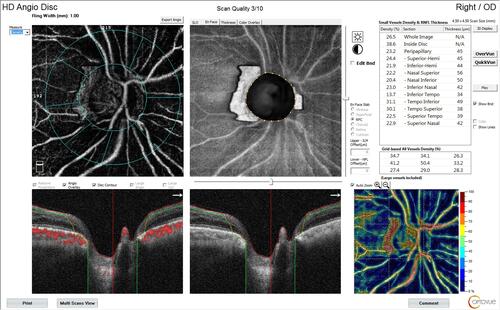
Figure 9 OCT-A of the ONH and peripapillary area of patient number 4 in group II after injection of peribulbar anesthesia.
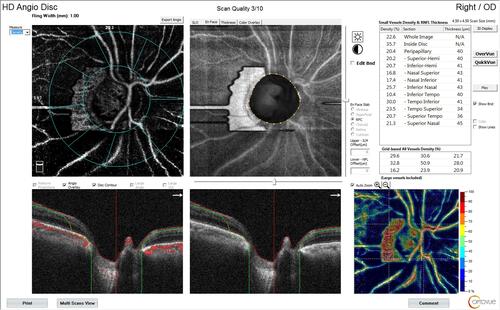
Figure 10 OCT-A of the SCP of patient number 4 in group II before injection of peribulbar anesthesia.
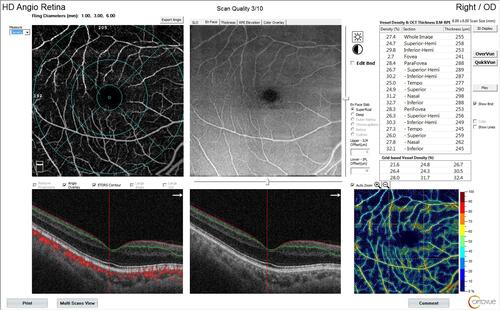
Figure 11 OCT-A of the SCP of patient number 4 in group II after injection of peribulbar anesthesia.
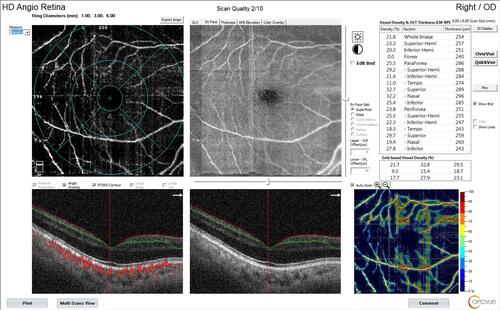
Table 3 Pre and Post-Injection OCT Parameters in Both Groups
Figure 12 OCT-A of the SCP of patient number 7 in group I before injection of peribulbar anesthesia.
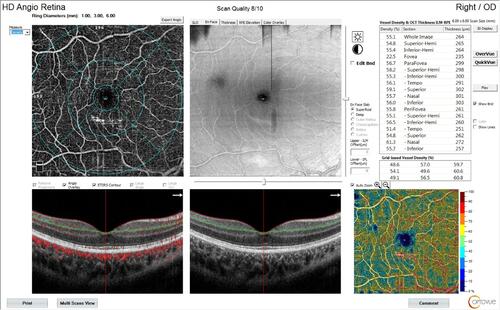
Figure 13 OCT-A of the SCP of patient number 7 in group I after injection of peribulbar anesthesia.
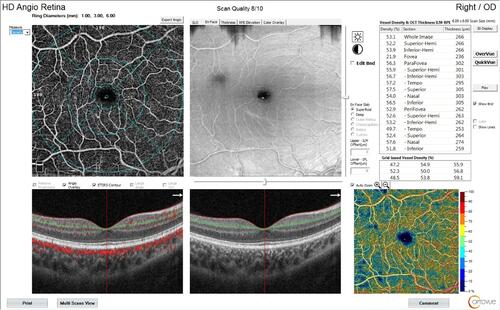
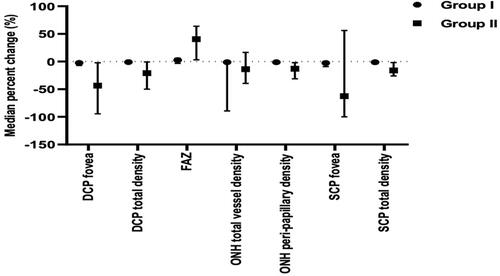
Figure 14 Pre and post-injection OCT-A parameters in both groups.