
Figures & data
Table 1 Preoperative Patient Demographics
Figure 1 Postoperative refractive outcomes: (A) Spherical equivalent refraction, (B) Refractive astigmatism, (C) Target-induced astigmatism vs surgically induced astigmatism, and (D) Refractive astigmatism angle of error.
Abbreviations: D, diopters; SEQ, spherical equivalent refraction; SIA, surgically induced astigmatism; TIA, target-induced astigmatism.
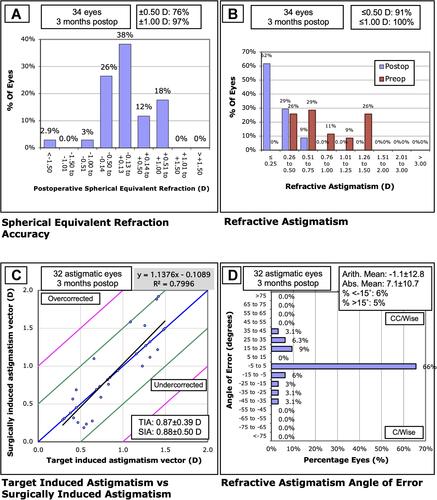
Figure 2 Histogram of the postoperative absolute refractive prediction errors (n=31).
Abbreviation: D, diopters.
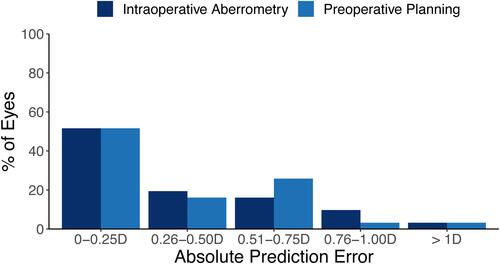
Figure 3 Histogram of the postoperative residual astigmatism (n=34).
Abbreviation: D, diopters.
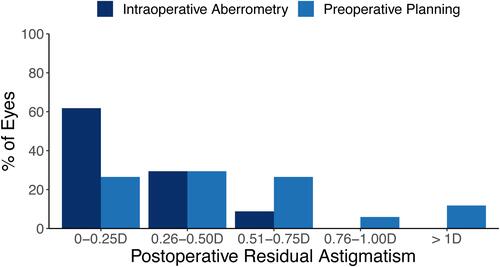
Figure 4 Double angle vector plots of astigmatism vectors for (A) Preoperative, (B) Intraoperative aberrometry, and (C) Preoperative planned power. Each ring represents 0.5 D. The diamond represents the centroid.
Abbreviations: N, 34 eyes. D, diopters; Stdev, standard deviation.
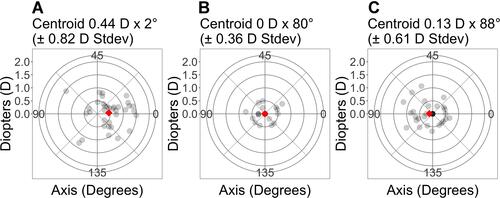
Table 2 Postoperative Visual Acuity