Figures & data
Figure 1 The foveal avascular zone was manually circumscribed on an early-phase fluorescein angiogram and the software measured the area (in mm2).
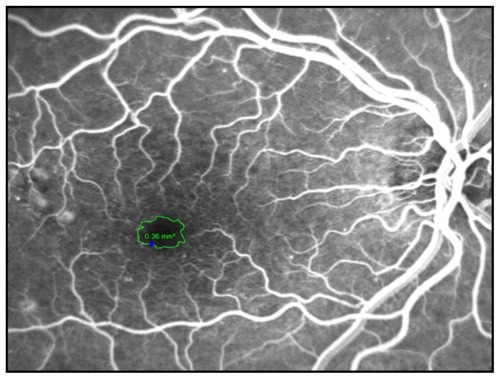
Figure 2 Box plots summarize the increase in foveal avascular zone area (mm2) at FU1 compared to pre OP measurements for all patients (overall) and the patients with DME and BRVO.
Abbreviations: BRVO, branch retinal vein occlusion; DME, diabetic macular edema; FU1, first follow-up visit; Pre OP, before injection of bevacizumab.
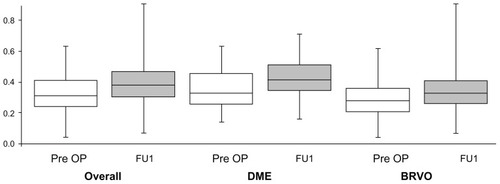
Table 1 Foveal avascular zone area measurements