Figures & data
Figure 1 Examples before and after laser. Two sample patients conventionally treated (patient A) or treated by Navilas® (patient B). (A) Fluorescein angiography with treatment area marked. (B) Navilas fundus photograph with fluorescein angiography overlay and preplanned laser spots. (C) Three-month follow-up on fluorescein angiography. (D) Fluorescein angiogram with executed laser treatment spots marked by Navilas.
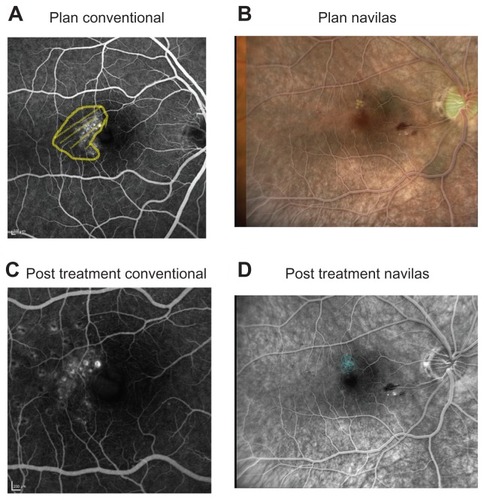
Table 1 Baseline patient characteristics
Figure 2 Visual acuity change over time (mean letters gained).
Note: *Indicates statistical significance.
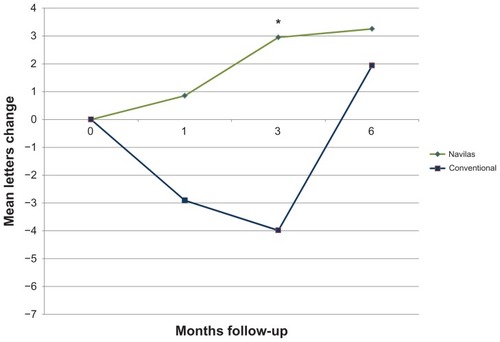
Figure 3 Visual acuity change over time [letters gained] matched for age, gender, and baseline visual acuity but unmatched for the number of laser spots.
Note: *Indicates significant difference.
![Figure 3 Visual acuity change over time [letters gained] matched for age, gender, and baseline visual acuity but unmatched for the number of laser spots.](/cms/asset/1721414d-4e15-4fbc-9835-97667d3b1794/doph_a_38559_f0003_c.jpg)
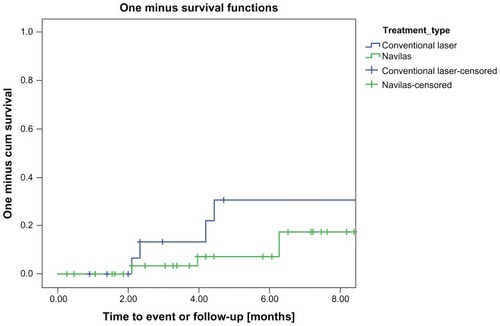
Figure 4 Kaplan-Meier analysis of retreatment rate.
Notes: After approximately 2 months, the survival curves separate, indicating more retreatments for the conventional laser group (P = 0.02). The 3-month period after first laser treatment, in which usually no retreatment is performed, is marked green.